
Troubleshoot Rundeck - Strategies and Tools
Troubleshoot Rundeck - Strategies and Tools
Introduction
Rundeck offers a wide range of capabilities, empowering users to automate workflows, schedule jobs, and manage resources efficiently. However, like any software system, it is not immune to issues and glitches that may disrupt its smooth operation. Effective troubleshooting is a crucial skill when it comes to managing and maintaining Rundeck. Having a strong troubleshooting mindset and knowing how to detect problems and determine their underlying causes are very helpful in ensuring the reliability and stability of Rundeck deployments.
This guide explores the significance of troubleshooting in the context of Rundeck and provides practical insights on where to look for common problems, how to analyze them, and how to report on them. By mastering the art of troubleshooting, you will be better equipped to identify and address any issues that arise, maximizing the productivity and efficiency of your Rundeck environment. These strategies and tools should work equally well with a Runbook Automation commercial installation.
Troubleshooting Strategy
The methods below will assist you in developing a troubleshooting plan in the event of an error. Rundeck is more than simply a Java program; it includes numerous plugins and integrations which could generate different kinds of errors.
- Understand Rundeck
Familiarize yourself with Rundeck architecture, components, plugins and dependencies. Study the documentation and gain a good understanding of how it works, including its configuration, deployment, and integration points. - Reproduce the Issue
Replicate the problem you are experiencing in a non-production environment. Note the steps you take to trigger the issue and any specific conditions or inputs required. This will help in isolating the problem and narrowing down potential causes. - Check the relevant Logs
Examine Rundeck logs for any error messages, warnings, or exceptions. These logs are typically located at this path:/var/logs/rundeck. Pay attention to timestamps, error codes, stack traces, and any relevant information that can provide clues about the issue (check the Where to look if something goes wrong section in this guide for more info on logs and their locations). - Analyze Stack Traces
If there are exceptions or errors reported in the logs, analyze the stack traces to identify the root cause. Look for any similar errors reported in the GitHub Rundeck space. - Review Configuration
Inspect the application's configuration files, likerundeck-config.propertiesorframework.properties. Check for any misconfigurations, missing properties, or conflicting settings that could be causing the problem. Compare the configuration against the documentation or known working setups. - Monitor Resources
Monitor the system’s resources (CPU, memory, disk usage). High resource utilization or spikes in usage can lead to performance issues or even application failures. Use system monitoring tools to collect and analyze resource metrics (check the “Monitoring Tools” section in this guide). - Verify Network Connectivity
Ensure that the Java web application can communicate with its dependencies, such as backends, external services, or APIs. Check network connectivity, firewall settings, and DNS configurations to rule out any network-related issues. - Test External Integrations
If the Rundeck instance interacts with other systems or services, test the integrations individually to validate their functionality. This includes verifying authentication credentials, API endpoints, data exchanges, and any relevant protocols. - Analyze Database Performance
If you’re using an external backend database, review the database performance metrics and query execution times. Check for indexing issues, and ensure database connections are properly managed, including the backend connection string in therundeck-config.propertiesfile. - Update Dependencies
Outdated or unsupported dependencies may have known issues or security vulnerabilities that can impact the application's performance or stability. Example: Some Python-based plugins need specificpipmodules; sometimes an older version of those modules could cause problems with the plugin functionalities. - Consider Performance Profiling
Use profiling tools to identify performance bottlenecks within the application. Profile critical sections of code, analyze method execution times, and identify CPU/Memory intensive operations (Check the Monitoring Tools section in this guide).
Where to look if something goes wrong
Understanding the location and significance of logs in Rundeck is of utmost importance when it comes to effective troubleshooting. In such situations, having knowledge of where Rundeck stores its logs and configuration files can greatly facilitate the troubleshooting process. These files serve as a valuable source of information, providing insights into the system's behavior, error messages, and potential misconfigurations.
By familiarizing yourself with the locations and contents of these files, you gain the ability to diagnose problems accurately, identify root causes efficiently, and ultimately restore the stability and reliability of your Rundeck environment.
The service.log file
The main place to see anything related to Rundeck is the service.log file. This log file stores all the standard input and output generated during runtime, so this is where you will see any problems related to plugins, executions, and Rundeck in general.
Location:
- For RPM/DEB based installations In the
/var/log/rundeckdirectory - For WAR-based installations In the
$RDECK_BASE/var/logpath (the service needs to be launched using the$RDECK_BASE/sbin/rundeckdscript, the process is described here). - For Windows-based instances Defined on the launch
.batscript. - For docker containers output is available directly in the docker logs. To see it, just execute
docker logs -f RUNDECK_CONTAINER_ID
Understanding service.log stack traces
Lines reported to the service.log file that resembles the code below are frequently the first indication that anything is wrong on Rundeck.
An example of a Rundeck stack trace is shown below (taken from this solved case):
org.grails.taglib.GrailsTagException: [views/layouts/base.gsp:180] Error executing tag <g:render>: Project does not exist: *
   at org.grails.gsp.GroovyPage.throwRootCause(GroovyPage.java:473)
   at org.grails.gsp.GroovyPage.invokeTag(GroovyPage.java:415)
   at sun.reflect.GeneratedMethodAccessor209.invoke(Unknown Source)
   at sun.reflect.DelegatingMethodAccessorImpl.invoke(DelegatingMethodAccessorImpl.java:43)
   at java.lang.reflect.Method.invoke(Method.java:498)
   at org.codehaus.groovy.reflection.CachedMethod.invoke(CachedMethod.java:98)
   at groovy.lang.MetaMethod.doMethodInvoke(MetaMethod.java:325)
   at org.codehaus.groovy.runtime.metaclass.ClosureMetaClass.invokeMethod(ClosureMetaClass.java:352)
   at groovy.lang.MetaClassImpl.invokeMethod(MetaClassImpl.java:1034)
   at org.codehaus.groovy.runtime.callsite.PogoMetaClassSite.callCurrent(PogoMetaClassSite.java:68)
   at org.codehaus.groovy.runtime.callsite.CallSiteArray.defaultCallCurrent(CallSiteArray.java:51)
   at org.codehaus.groovy.runtime.callsite.AbstractCallSite.callCurrent(AbstractCallSite.java:157)
   at gsp_rundeckapp_layoutsbase_gsp$_run_closure2.doCall(gsp_rundeckapp_layoutsbase_gsp.groovy:259)
   at sun.reflect.NativeMethodAccessorImpl.invoke0(Native Method)
   ...
   at java.lang.Thread.run(Thread.java:748)
Caused by: com.dtolabs.rundeck.core.common.NoSuchResourceException: Project does not exist: *
   at com.dtolabs.rundeck.core.common.FrameworkProjectMgr.getFrameworkProject(FrameworkProjectMgr.java:202)
   at com.dtolabs.rundeck.core.common.FrameworkProjectMgr.getFrameworkProject(FrameworkProjectMgr.java:28)
   at rundeck.services.FrameworkService.getFrameworkProject(FrameworkService.groovy:297)
   at rundeck.services.FrameworkService$getFrameworkProject$2.callCurrent(Unknown Source)
   at rundeck.services.FrameworkService.getAuthContextForSubjectAndProject(FrameworkService.groovy:723)
   at com.dtolabs.rundeck.core.authorization.AuthContextProvider$getAuthContextForSubjectAndProject.call(Unknown Source)
   ...
   at org.codehaus.groovy.runtime.callsite.CallSiteArray.defaultCall(CallSiteArray.java:47)
   at org.codehaus.groovy.runtime.callsite.AbstractCallSite.call(AbstractCallSite.java:116)
   at org.codehaus.groovy.runtime.callsite.AbstractCallSite.call(AbstractCallSite.java:136)
   at rundeck.AuthTagLib$_closure5.doCall(AuthTagLib.groovy:234)
   at sun.reflect.NativeMethodAccessorImpl.invoke0(Native Method)
   ... 139 common frames omitted
The call stack (sets of active stack frames) and the methods that Rundeck calls are displayed in a stack trace.
Usually, when an Exception is not handled properly in code, a stack trace is displayed. (A runtime environment notifies you of a bug in your code through an exception.) It could be a form of built-in exception or a special exception made by a program or a Rundeck plugin.
It is also possible for code to throw an Exception without an explicit throw statement, for example, you can get:
- NullPointerException if obj is null in code which calls obj.someMethod()
- There are some other examples in the Java Language Specification, so it’s important to be aware that Exceptions can arise without being explicitly thrown.
Other relevant logs
There are other logs to look for if something gets wrong in Rundeck, most relevant are:
rundeck.log
Contains all general applications messages, like warnings and errors.
rundeck.audit.log
Contains ACL-related authorization messages.
rundeck.access.log
User access is recorded in this log.
rundeck.api.log
This log stores all API access events. This is useful to determine calls from external applications/code to the web API.
Common Java Application Errors
In this section, we'll look at some common problems in a Java application like Rundeck.
Java Exceptions
Java exceptions can be triggered by a number of circumstances, including internal syntax and logic problems, as well as resource exhaustion. Java exceptions are frequently traceable back to the original Java code, therefore diagnosing this type of mistake requires a solid understanding of Java and its libraries/dependencies.
Common Java Exceptions and Solutions:
- NullPointerException This exception is thrown when Java attempts to access an item with a 'null' reference value.
- IllegalArgumentException This exception is thrown when Java attempts to pass an invalid argument to a function or method.
Exception Troubleshooting tips:
- Check Rundeck system logs for additional information about the exception and the possible root cause (check the Where to look if something goes wrong section in this guide).
- Create a report step by step on the Rundeck GitHub space to replicate the error (check the Where and how to report a Rundeck bug section in this guide).
Performance Issues
Java performance issues can be caused by a variety of factors, including inefficient code, poor network connections, and resource contention. Java profiling tools are critical for finding and fixing performance problems.
Performance Troubleshooting Tips:
- Check Rundeck system logs to identify possible causes of Java performance issues. The
service.logfile is the main source to obtain information about the Rundeck instance. - Use Java monitoring and profiling tools to identify which Java methods and objects are taking too long to process (check the Monitoring Tools section in this guide).
- Adjust Rundeck system parameters such as Heap size or Thread pool size to improve Java's performance (check the Tuning Rundeck section in this guide).
Out of Memory Errors
The java.lang.OutOfMemoryError indicates that your application tried to keep more data in memory than it could handle, resulting in random failures from which Rundeck cannot recover.
This error can occur for many reasons, such as:
- Java heap space may be insufficient.
- Native libraries may have been loaded into Java heap space but not released.
- Java objects may be referred to excessively.
Out of Memory Troubleshooting Tips:
- Increase the Java heap size by adding the
-Xmxparameter to your Java command line. This will allow Java to allocate more memory for its objects. - In case to use other applications on the Java Virtual Machine you may consider reducing the number of applications running in the Java Virtual Machine.
- Check if the server has sufficient physical memory available.
Database LockException
When Rundeck/Runbook Automation starts it needs to check for the database status to be up to date. This process is handled by a Liquibase migration progress (this process runs each time the software starts, it is not only related to an upgrade).
If there is an interruption while starting Rundeck/Runbook Automation, the database can get into an "stuck" state while performing the Liquibase migration process, this can prevent Rundeck/Runbook Automation from starting. It is possible to recover from this state, but the steps must be carefully followed.
- Make sure there are no Rundeck/Runbook Automation instances running.
- Once all instances are down, perform an update directly to the DB and change the "LOCKED" status
- Update table "DATABASECHANGELOGLOCK" field "LOCKED" to
false. (Some databases uses0/1instead of a text, if that is the case, set the value to0) - You can now start the software again and it should be able to obtain lock and perform the Liquibase migration process.
Update example query update DATABASECHANGELOGLOCK set LOCKED = false where ID = 1
Example stacktrace of a stuck db
[2023-11-22T16:21:28,445] ERROR rundeckapp.Application [main] - Cannot obtain lock on table DATABASECHANGELOGLOCK. This could be due to a database connection issue when starting a Runbook Automation instance.
To force the unlock you must first make sure that are no Runbook Automation instances running using this DB. You can change the lock status directly on the database and start Runbook Automation again by setting 'LOCKED' field in the table 'DATABASECHANGELOGLOCK' as false (or 0 depending on the database)
liquibase.exception.LockException: Could not acquire change log lock.  Currently locked by MY_PC (192.168.3.29) since 11/20/23, 2:20 PM
	at liquibase.lockservice.StandardLockService.waitForLock(StandardLockService.java:275) ~[liquibase-core-4.19.0.jar:?]
	at liquibase.Liquibase.lambda$update$1(Liquibase.java:239) ~[liquibase-core-4.19.0.jar:?]
	at liquibase.Scope.lambda$child$0(Scope.java:180) ~[liquibase-core-4.19.0.jar:?]
	at liquibase.Scope.child(Scope.java:189) ~[liquibase-core-4.19.0.jar:?]
	at liquibase.Scope.child(Scope.java:179) ~[liquibase-core-4.19.0.jar:?]
Tuning Rundeck to avoid performance problems
Efficiently tuning Rundeck for optimal performance is crucial, particularly in production environments where speed and reliability are essential.
By optimizing Rundeck, you can enhance resource utilization, reduce response times, and handle higher workloads seamlessly. This not only boosts overall system performance but also ensures that Rundeck meets the demands of your production environment reliably.
By gaining expertise in these optimization techniques and learning how to apply them effectively, you can unleash the full potential of Rundeck, achieving exceptional performance and scalability in your production environment.
File Descriptors
A File Descriptor is a unique identifier or reference to an open file within a computer operating system. In most operating systems, including the different Linux “flavors”, file descriptors are used to access various types of input and output (I/O) resources such as files, sockets, pipes, and devices. When a file is opened, the operating system assigns a file descriptor to it, which is used to interact with and perform operations on the file.
If your Rundeck instance attempts to exceed the limit, you will see an error like the one shown below in your service.log file.
Too many open files
To solve it, follow this documentation entry.
Java Heap Size
In Java, the heap is a region of memory that is used for dynamic memory allocation. The Java Heap is specifically allocated for objects created by Java programs during runtime. The Java Heap size refers to the total amount of memory allocated to the Java Virtual Machine (JVM) for the heap.
The heap size determines the maximum amount of memory available for allocating objects in Java. It is important because it directly impacts the performance and behavior of Java applications. If the heap size is too small, it may lead to frequent garbage collections and out-of-memory errors, resulting in application crashes. On the other hand, an excessively large heap size can consume more memory than necessary and may cause inefficient memory usage.
The heap size is configurable and can be set using JVM command-line options (on the Rundeck launch script). The two commonly used options are -Xms and -Xmx.
-Xmsspecifies the initial heap size, which is the amount of memory allocated to the JVM when it starts.-Xmxspecifies the maximum heap size, which is the upper limit on the amount of memory that the JVM can allocate for the heap during runtime.
By adjusting these options on the Rundeck launch script, you can control the initial and maximum heap sizes according to the requirements of your Java application.
It is important to strike a balance by setting an appropriate heap size based on factors such as the size and complexity of the application, expected workload, and available system resources.
Take a look at the official documentation-related entry.
Quartz job threadCount
In Quartz (a crucial Rundeck component), the threadCount refers to the number of worker threads that are available for executing jobs and triggers within the scheduler. Each thread in Quartz is responsible for executing a job or trigger at the specified time or based on the configured schedule.
The value of threadCount indicates the maximum number of simultaneous job executions that can occur at any given time.
The threadCount configuration is crucial for controlling the concurrency and throughput of your Quartz scheduler. It allows you to control how many jobs can be executed concurrently and ensures that the scheduler can handle the workload efficiently. By adjusting the threadCount based on your application's requirements and the available system resources, you can optimize the job execution and prevent overloading the system.
If your workload needs more than the default concurrent threads (10) follow this doc entry to configure Rundeck properly.
Monitoring Tools
Java monitoring tools play a vital role in ensuring the smooth operation and optimal performance of Java applications. These tools provide valuable insights into the runtime behavior, resource utilization, and potential bottlenecks within the application.
JDK Mission Control and VisualVM are two well-regarded options for Java developers and system administrators.
JDK Mission Control
JDK Mission Control is a comprehensive performance analysis and diagnostics tool provided by Oracle for Java applications. It is specifically designed for monitoring and profiling Java applications.
Here is how to use JDK Mission Control to monitor Rundeck:
Installation and Configuration
- Install by downloading from this link. Just download and uncompress the file.
- Launch JDK Mission Control by executing the "jmc" command, available in the uncompressed directory.
- Connect to a Rundeck instance by locating the Rundeck process on the left side list and see the available monitoring/profiling options with a right click.
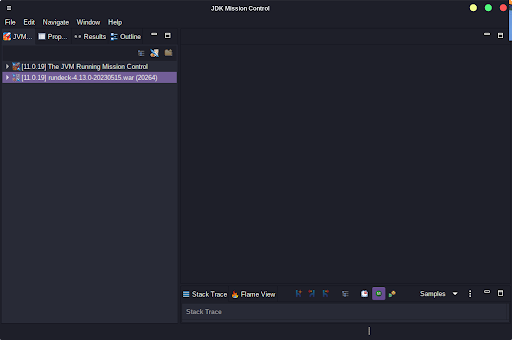
Monitoring Rundeck
- To start monitoring Rundeck, select “Start JMX Console”.
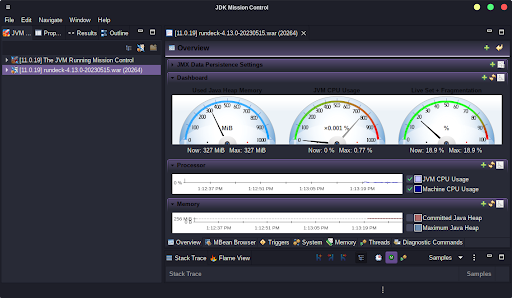
- The "Overview" tab presents a summary of CPU usage, memory usage, thread activity, and more.
- Explore different tabs and views to access detailed information about the JVM, threads, memory, and other components.
Profiling
- Click on the "Start Flight Recording" button in the toolbar or right-click on the application and choose "Start Flight Recording".
- Perform the actions you want to analyze while the recording is active.
- Once done, stop the recording by clicking the "Stop Flight Recording" button or right-clicking on the application and selecting "Stop Flight Recording".
- Analyze the recorded data using various views and analysis tools provided by JDK Mission Control.
Advanced Analysis and Troubleshooting
- Explore the various analysis tools and views, such as "Method Profiling", "Lock Instances", "Hot Methods", and "Contention". These tools help identify bottlenecks, lock contention, and performance hotspots in your application.
Visual VM
VisualVM is an analysis tool for Java-based applications. It provides a graphical user interface for monitoring, profiling, and troubleshooting Java applications running on the Java Virtual Machine (JVM).
Download and Installation
- Visit the VisualVM website at https://visualvm.github.io/.
- Click on the "Download" section and select the appropriate version for your operating system.
- Once downloaded, extract the contents of the archive to a directory of your choice.
- Launch VisualVM by navigating to the extracted VisualVM directory and executing the
visualvmexecutable file (orvisualvm.exeon Windows).
Connecting to a Local Rundeck instance
- Once VisualVM opens, it automatically detects running JVM processes and displays them in the left-hand side panel.
- Locate the Rundeck app in the list and double-click on it to connect.
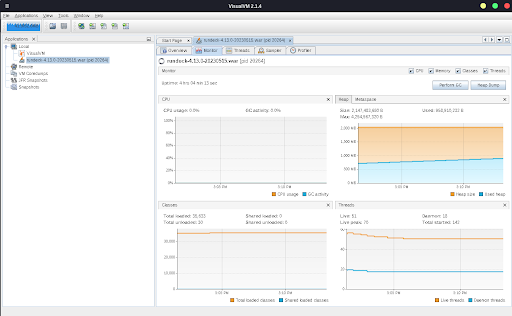
Monitoring Rundeck
- After connecting to Rundeck, VisualVM displays a dashboard with real-time monitoring data.
- The overview tab provides an overview of CPU usage, memory usage, threads, classes, and more.
- You can explore different tabs and subtabs to access specific information about the JVM, threads, memory, and other components.
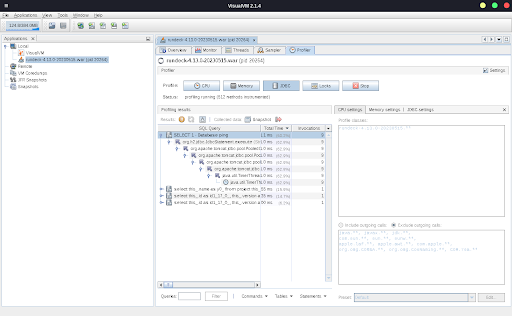
Profiling
- To start profiling, select your application from the left-hand side panel and click on the "Profiler" tab.
- Choose the profiling mode based on your requirements, such as CPU, memory, or sampler.
- Click on the "CPU" button to begin the CPU profiling session.
- Perform the actions you want to analyze, and VisualVM will collect profiling data.
- Once the session is complete, VisualVM presents the profiling results for further analysis.
Where and how to report a Rundeck bug
You can report bugs on the Official Rundeck GitHub space located here. The following steps are crucial to report a Rundeck bug officially.
The main requirement is to have a GitHub Account, you can create your account here.
Steps to reporting a bug
- Check Existing Issues
Before reporting a bug, it's important to check the existing issues on the Rundeck GitHub repository. Make sure that the bug you encountered hasn't already been reported by someone else. If you find a similar issue, you can comment on that thread to provide additional information. - Open a New Issue
If you couldn't find a similar issue, click on the "Issues" tab in the repository and then click on the green "New Issue" button. - Provide a Descriptive Subject
Give your issue a clear and concise title that accurately describes the problem you're facing. - Describe the Bug
In the issue description, provide a detailed explanation of the bug you encountered. Include information such as the Rundeck version you're using, the operating system, the JRE version, and any relevant configurations (rundeck-config.propertiesandframework.propertiesin most cases). As a tip, you can hide or change any potentially sensitive information related to your organization. - Steps to Reproduce
One of the most crucial aspects of bug reporting is providing clear steps to reproduce the problem. Break down the necessary steps in a numbered list, providing all the details required to recreate the bug. - Attach Screenshots
If the bug includes a visual aspect, take screenshots that clearly demonstrate the issue. You can use a tool like Lightshot, Snipping Tool (Windows), or Grab (macOS) to capture the screenshots. Include these images in your bug report to provide visual context for the developers. - Include the
service.logcontent
The service.log file contains valuable information for debugging. Locate the relevant entries that are related to the bug you encountered. Copy and paste the relevant log content into your bug report. If the log is too large, use a service like GitHub Gist. - Provide Additional Information
If you have any additional information related to the bug, such as error messages, warnings, or relevant log files other thanservice.log, make sure to include them in your report. - Submit the Issue
After you have provided all the necessary information, click on the "Submit new issue" button to create the bug report.