Integrate Rundeck with ELK
Integrate Rundeck with ELK
Integrating Rundeck logs with an ELK server allows you to centralize, analyze, and visualize the log data generated by Rundeck. By leveraging ELK's powerful log management and analysis capabilities, you can gain deeper insights into your Rundeck operations, improve troubleshooting, and enhance operational efficiency.
What is ELK?
ELK is an acronym for Elasticsearch, Logstash, and Kibana, which are three open-source tools that are commonly used together for log management and data analysis purposes. Here's a brief description of each component:
Elasticsearch: Elasticsearch is a distributed, scalable, and highly available search and analytics engine. It is designed to store, search, and analyze large volumes of data in real time. Elasticsearch is built on top of Apache Lucene and provides full-text search capabilities and advanced querying and filtering options.
Logstash: Logstash is a data processing pipeline that ingests and transforms data from various sources. It collects data from different inputs, such as log files, databases, or message queues, and applies filters and transformations to parse and structure the data. Logstash then sends the processed data to Elasticsearch for indexing and storage.
Kibana: Kibana is a web-based data visualization and exploration tool that provides a user-friendly interface for interacting with data stored in Elasticsearch. It allows users to create visualizations, dashboards, and ad-hoc queries to analyze and explore the indexed data. Kibana supports various types of visualizations like line charts, bar charts, maps, and tables.
One of the most common use cases of the ELK stack is centralized log management and analysis. Organizations often generate a large amount of log data from various systems, applications, and infrastructure components. ELK helps in effectively collecting, indexing, analyzing, and visualizing these logs.
In the case of Rundeck, integrating with ELK has some of the following advantages:
Centralized Log Storage: Rundeck generates logs that provide valuable insights into job executions, system activity, and user interactions. By integrating Rundeck logs with an ELK server, you can consolidate all the logs in a central location. This centralization simplifies log management, ensures data integrity, and allows for easy access to historical log information.
Search and Filtering Capabilities: ELK offers robust search and filtering capabilities, enabling you to efficiently search and analyze Rundeck logs. With ELK, you can perform full-text searches, filter logs based on specific criteria (e.g., job names, execution IDs, error messages), and use advanced querying techniques to identify patterns and anomalies in Rundeck log data.
Visualization and Dashboards: Kibana, a component of ELK, provides powerful visualization capabilities. By integrating Rundeck logs with Kibana, you can create custom dashboards and visualizations to present log data in a meaningful way.
ELK Configuration
Creating the Logstash Pipeline
In Logstash, a pipeline refers to a sequence of stages through which data flows for processing. Each stage in the pipeline performs a specific task, such as input data collection, data transformation, filtering, and output to a destination. A Logstash pipeline typically consists of three main components: input, filter, and output.
To configure the Logstash pipeline, you need to create a configuration file that describes the sequence of inputs, filters, and outputs. Here's a step-by-step process. In this example, let's create a Rundeck specific pipeline as follows:
- Create a new configuration file with a
.confextension (rundeck.conf). - Open the configuration file in a text editor and enter the following content:
input { tcp { codec => "json" host => "0.0.0.0" mode => server port => 9600 tags => ["rundeck"] type => "rundeck" } } output { elasticsearch { hosts => [ "elasticsearch.url.here:9200" ] } } - Save the configuration file.
- Run Logstash with the configuration file using the command:
logstash -f rundeck.conf.
More information about Logstash pipelines here.
Creating the Index Pattern on Kibana
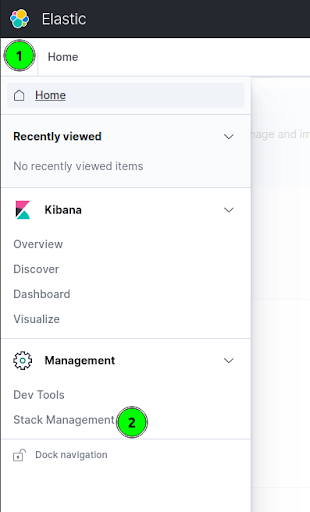
- In the Kibana server web interface (listening on port 5601 by default), click on the top left menu icon and then click on the "Stack Management".
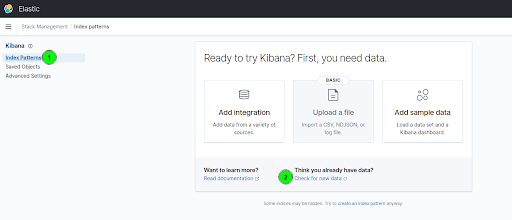
- Now click the "Index Patterns" link (left) and then click on "Check for new data."
- In the Index pattern name field, you should use the pattern
logstash-*. Click the "Next Step" button.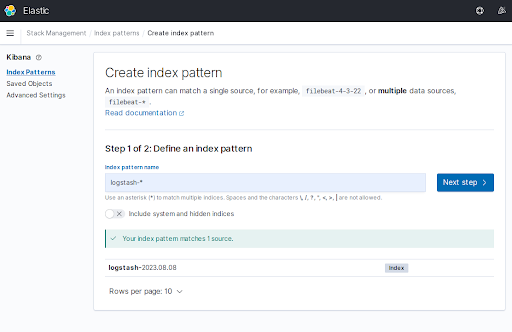
- On the "Time field" list, select
@timestamp. Then click on the "Create index pattern" button.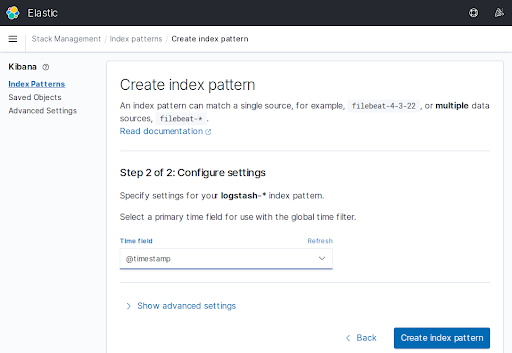
At this point, the Index Pattern has been created successfully.
Rundeck Configuration
To integrate Rundeck to ELK, we need the Logstash plugin, and then configure Rundeck to send the logs to ELK.
Installing the Logstash plugin
To install the logstash Rundeck plugin download this .groovy file and save it in the libext directory.
Patching the plugin (needed)
Now edit the LogstashPlugin.groovy file and replace this section:
configuration{
    host defaultValue:"localhost", required:true, description: "Hostname to connect to"
        port required:true, description: "Port to connect to", type: 'Integer'
 }
with the following:
configuration{
    host (title:"Logstash Host", defaultValue: "localhost", required: true, description: "Hostname to connect to", type: 'String')
    port (title:"Logstash Port", defaultValue: "9600", required: true, description: "Port to connect to", type: 'Integer')
 }
Save the file.
rundeck-config properties file Configuration
Add the following line on the rundeck-config.properties file.
rundeck.execution.logs.streamingWriterPlugins=LogstashPlugin
Then restart the Rundeck service.
Testing the Rundeck/Kibana Integration
- On Rundeck, create a new project.
- Create a new job.
- Run the Job.
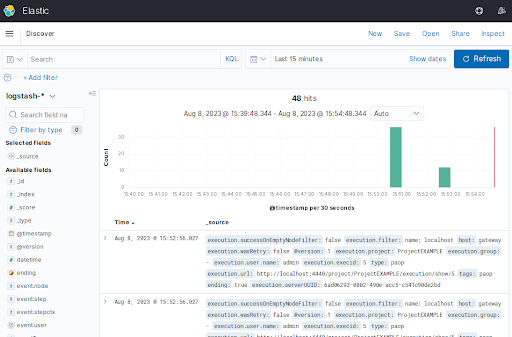
- Go to the Kibana server web GUI, click on the top left menu icon, and select "Discover''.
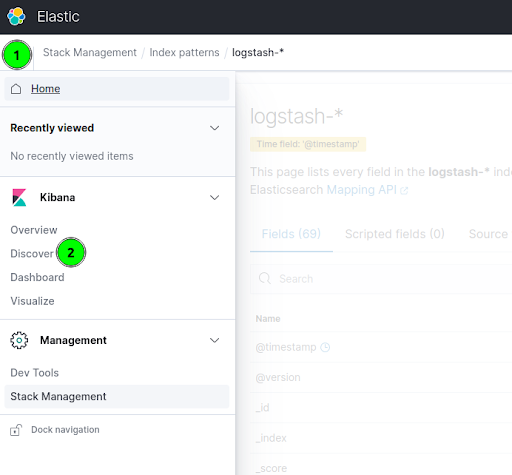
- In the "logstash-*" section you can see the Rundeck job activity.