
Automated Diagnostics
Automated Diagnostics
Observability Integrations
Retrieving diagnostics from monitoring tools is a common strategy for easily surfacing relevant logs and other diagnostic data to improve triage.
Examples
Log Queries
Retrieving logs from a monitoring tool or log-aggregator is a common first step for addressing alerts and incidents.
It is common to have saved queries in these tools to quickly surface relevant logs for similar types of issues.
Diagnostic Metrics
Some monitoring tools provide "diagnostic level" statistics - such as top cpu consuming processes. Retrieving these datapoints can help shorten the duration of incidents.
Mechanisms for Automated Diagnostics
Runbook Automation provides a handful of plugins that make it easy to integrate with common monitoring tools:
CloudWatch Logs
The CloudWatch Logs Ad Hoc Query plugin allows users to insert a Logs Insights query into a Job to surface logs from CloudWatch. 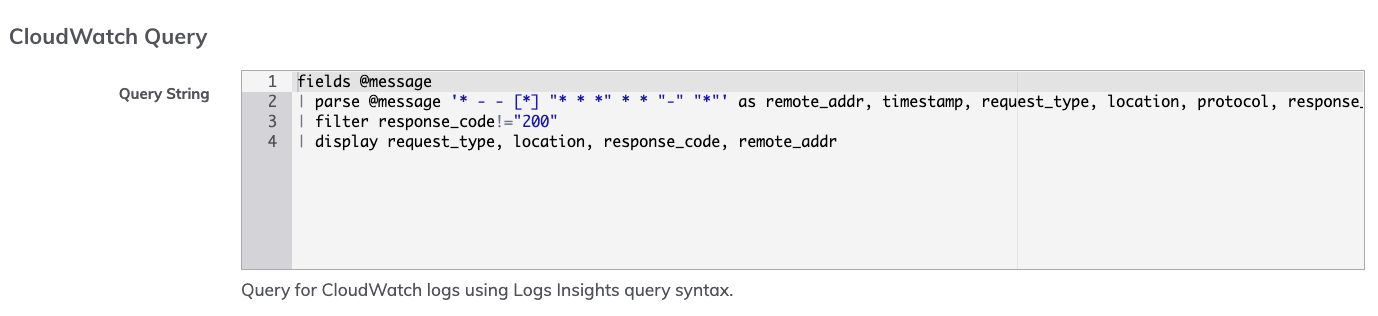
In addition, there is the CloudWatch Logs Saved Query plugin, which can trigger a saved query in CloudWatch against one or multiple CloudWatch log groups. 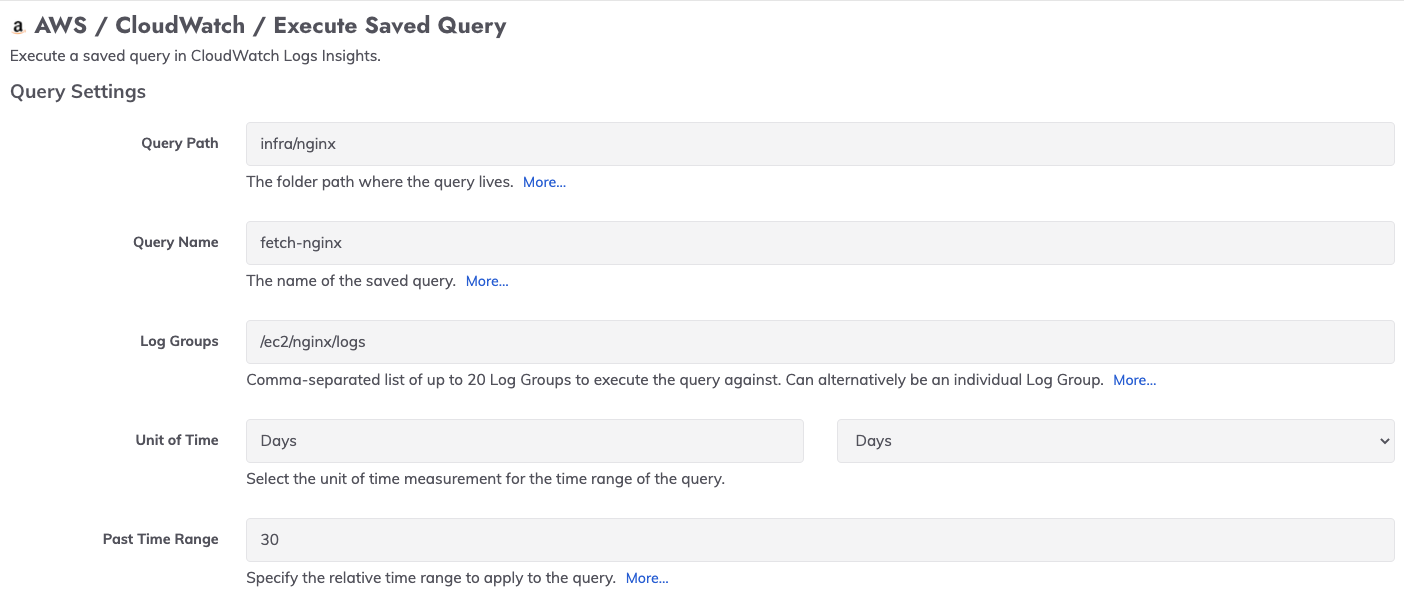
Sumo Logic Logs Query
Insert a Sumo Logic logs query into your Automation instance to surface logs from Sumo Logic: 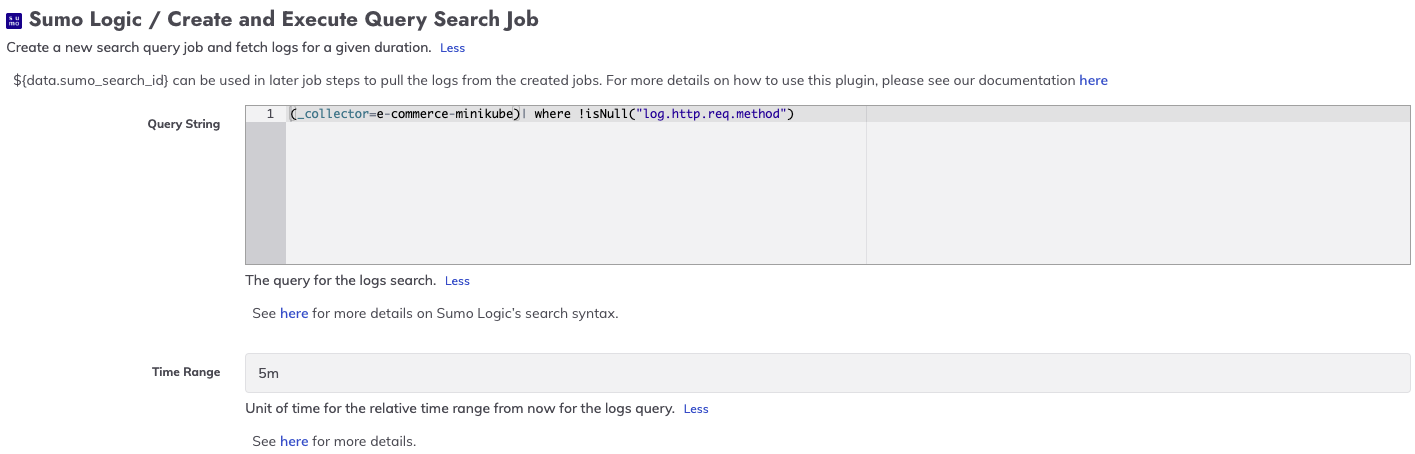
HTTP Request Step Plugin
The HTTP Request Plugin can make an API call to your monitoring tools to retrieve relevant diagnostic data.