
Automated Diagnostics
Automated Diagnostics
First Diagnostics Runbook
Now that your Runbook Automation instance has been integrated with Automation Actions, you’re ready to invoke your first Diagnostic Runbook.
Before jumping into your Automation instance, first create a PagerDuty API Key and copy or save it somewhere to be used later.
This will be used to add the Diagnostic data onto the PagerDuty Incident.
Navigate into your Automation instance. In the Automated Diagnostics project, click on the Third Party Service Disruptions job: 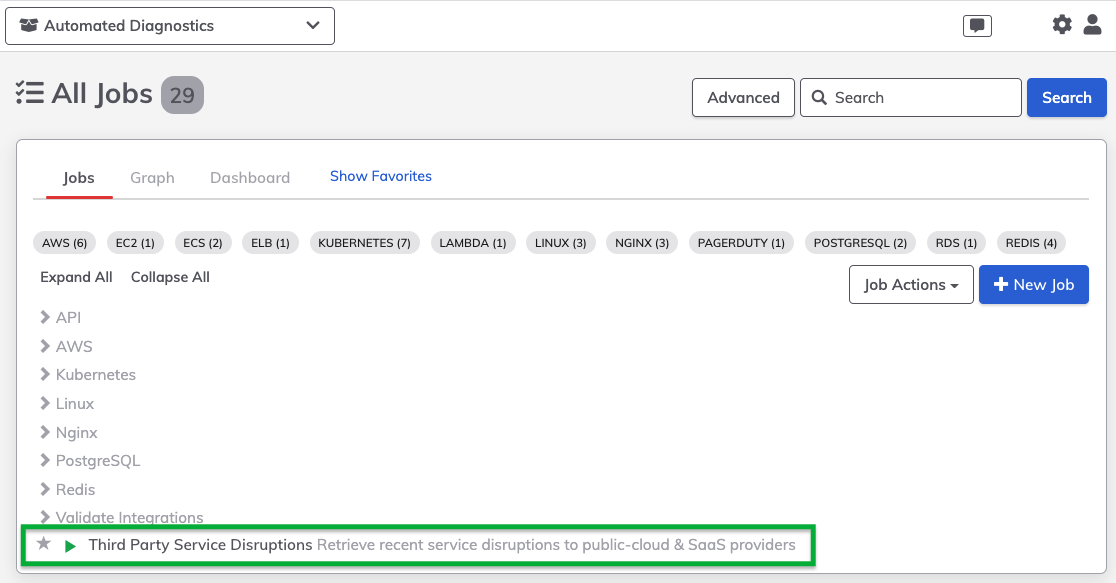
This Job retrieves recent service-disruptions from Public-cloud or SaaS providers: Click Run Job Now. You will see whether there have been recent incidents for the specific Public-cloud or SaaS provider.
Add PagerDuty Token into Key Storage
Navigate to Project Settings -> Key Storage. Click +Add or Upload a Key. Select Password for the Key Type. Paste the PagerDuty API Key you saved earlier into the field. Name the key pd-api-key.
Note
Be sure to name the key pd-api-key. Otherwise, the prewritten Jobs will not post to PagerDuty.
Add PagerDuty Email to Project Configuration
Next, we need to add a PagerDuty user’s email as a project setting. This is because Notes on the PagerDuty Incident must be associated with a particular user.
Tip
This can be a “placeholder” user in PagerDuty that is not associated with a particular person - such as a “service-account” user.
Navigate to Project Settings -> Edit Configuration -> Edit Configuration File.
Find the line that starts with project.globals.pd-email Replace the email address there with a valid PagerDuty user's email. Click on Save at the bottom of the page.
Invoke Diagnostic Runbook from PagerDuty
Navigate back to PagerDuty.
If you have not yet associated an Automation Action with a Service, follow the steps in the Integrating with Automation Actions section. Navigate to an Incident - either active or resolved - on the Service associated with your Automation Action. Click on Run Actions and click on the Action that was defined in the prior section. Click on Run Job.
When the page is refreshed, the following should now be visible on the Incident Timeline: 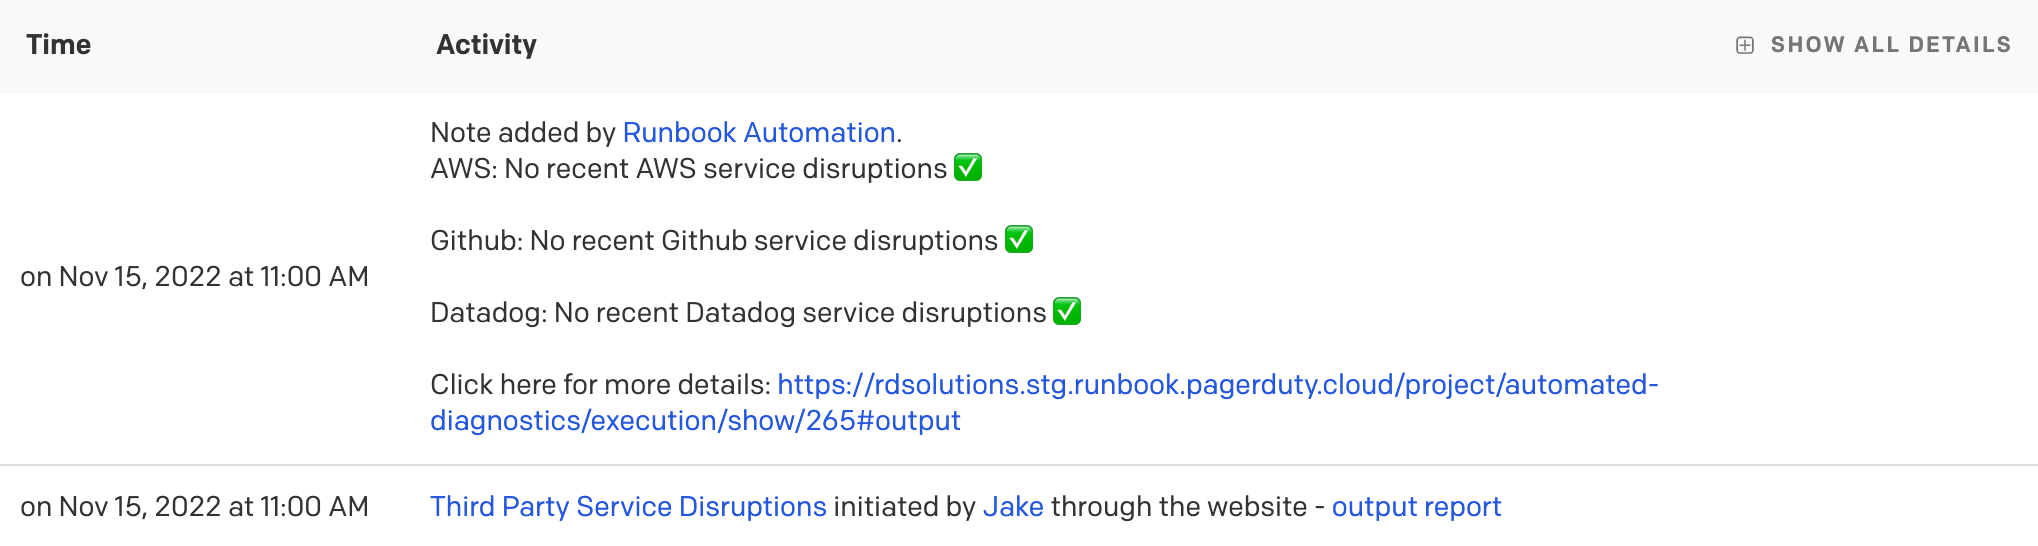
The output you see in PagerDuty is different from the content seen in the log output of the Diagnostic Runbook.
This is to demonstrate how verbose log data can be “simplified” so that a responder can make quick, informed decisions on where to start investigating or whom to pull in for assistance. With this sample Job - and others in the Automated Diagnostics Project - users can click the link in the Incident note to jump into the Automation instance to see the full diagnostic data output.
If desired, it is straightforward to send the "verbose" output to PagerDuty rather than just the simplified output.
Troubleshooting Sending Diagnostic Output to PagerDuty
If the diagnostic data did not get added to the Incident timeline, navigate back to the Automation interface. Navigate to the Activity tab.
If the Third Party Service Disruptions job was invoked at the same time the Automation Action was clicked in PagerDuty, click on the record in the Activity tab for that invocation.
Click on Log Output. Included below are possible error messages and steps to troubleshoot:
Please provide PagerDuty API token and Incident ID to send diagnostics to Incident. This likely means that the pd_incident_id Job Option was not correctly provided. Check the syntax of the variable in Automation Actions. Also make sure that the PagerDuty step within the Job is referencing ${option.pd_incident_id} for the Incident ID field.
"error":{"message":"Requester User Not Found","code":1008 The PagerDuty user email that was placed into the Project Configuration is not a valid user email. Change the value associated with the project.globals.pd-email property.
Error in PagerDuty request 401 The PagerDuty API Key placed in Key Storage was not a valid API Key. Details for other error codes can be found here.
Diagnostics in Chat Tools
The diagnostic data that you see in the Incident Timeline will also appear in the PagerDuty mobile app: 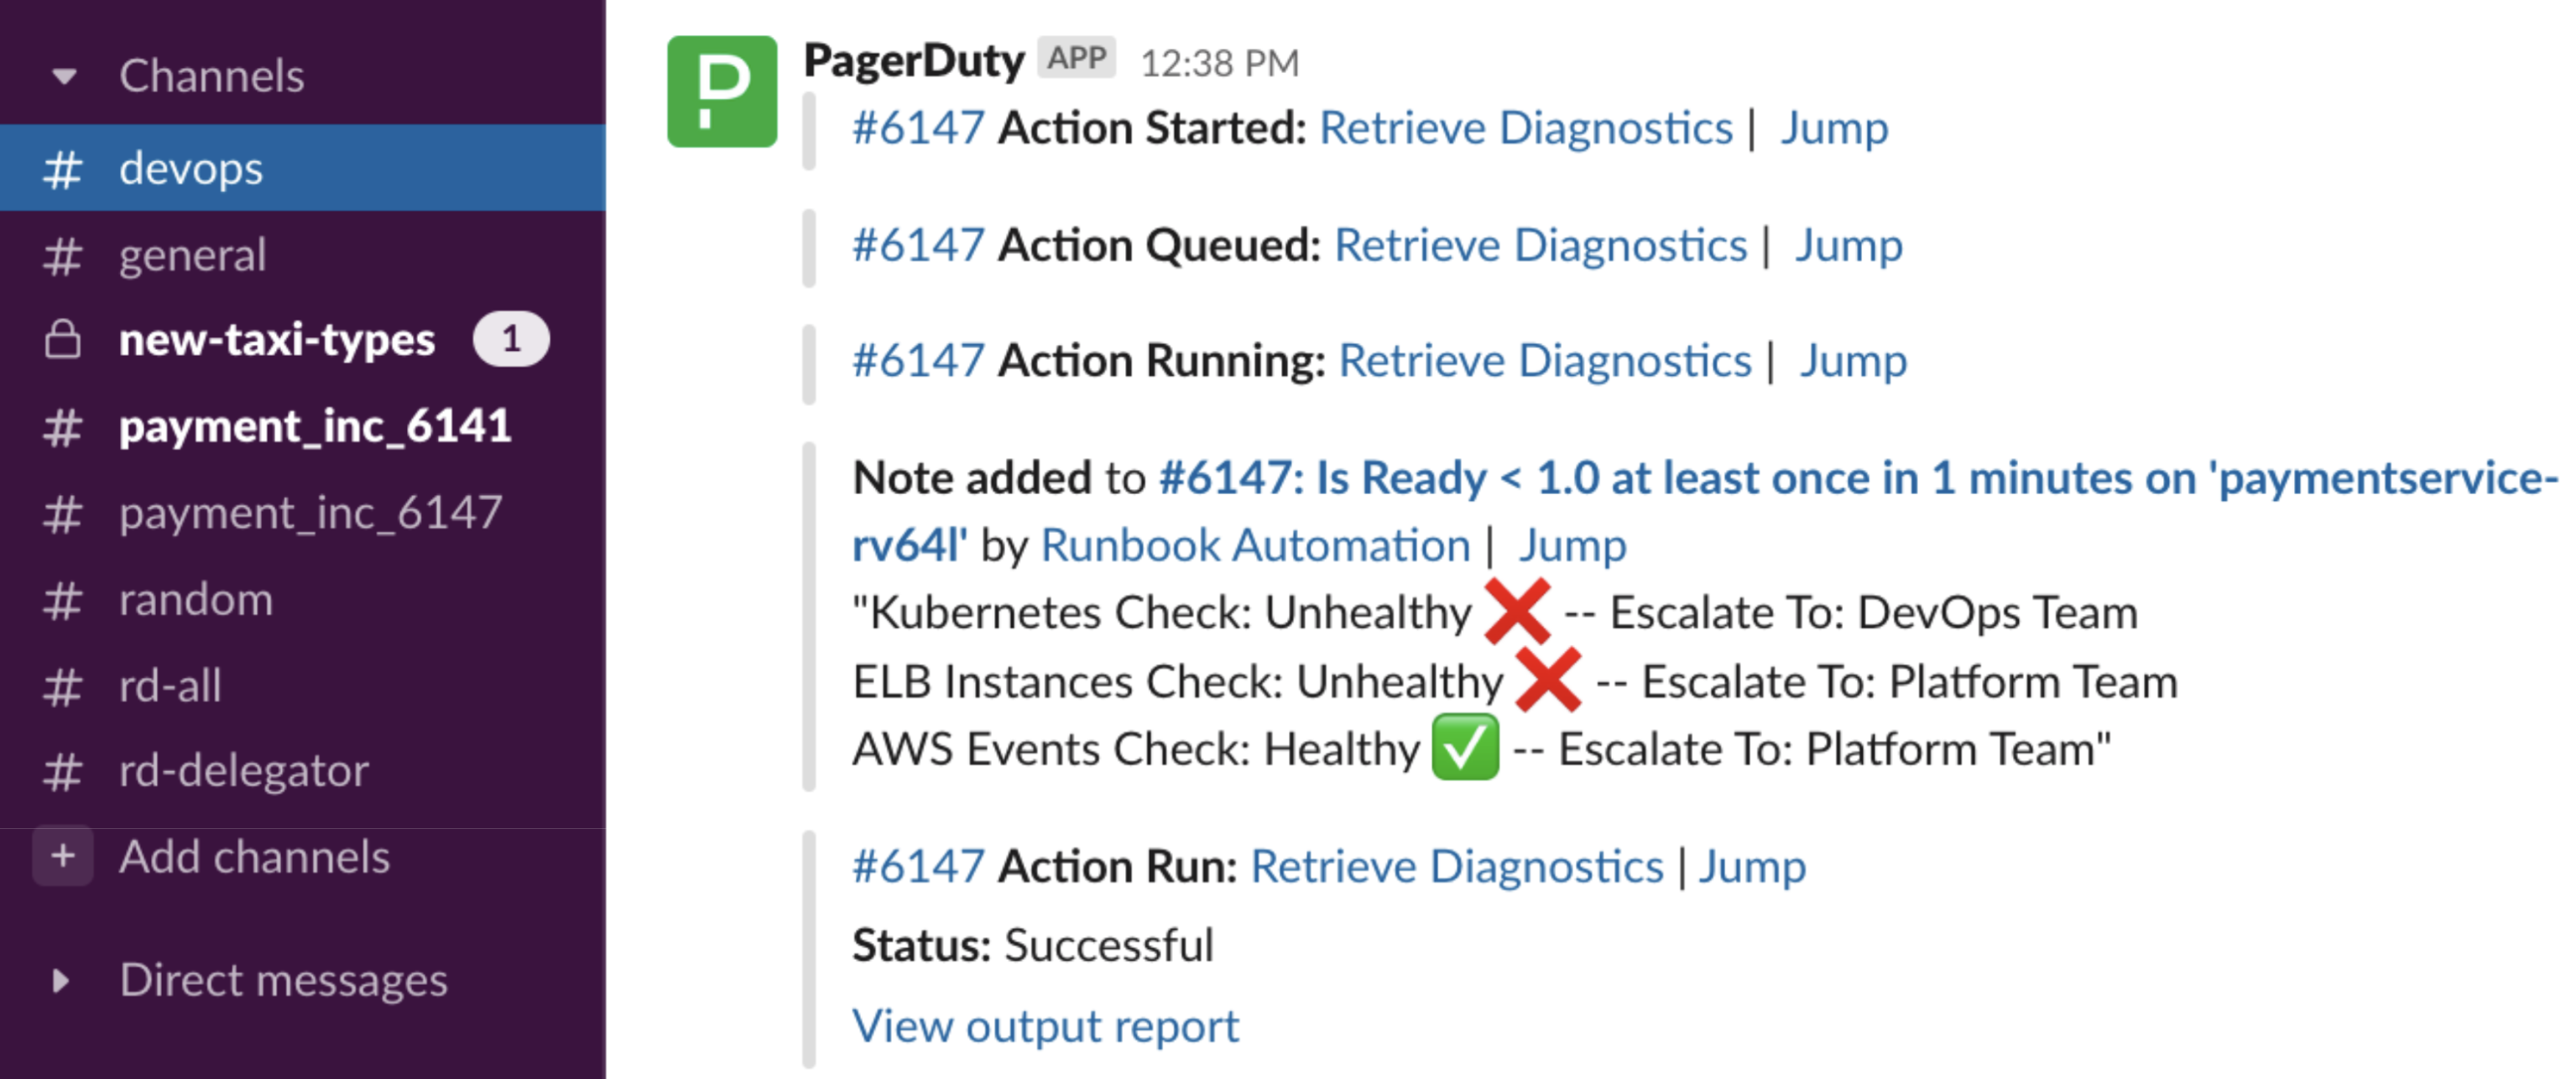
However, a large number of users manage and communicate incidents out of their company’s chat tool - such as Slack or Microsoft Teams. If you have already integrated these tools with PagerDuty, then the Diagnostics will appear in the Channels/Teams that are connected with Services or specific incidents.
The next section describes these integrations in more detail.