
Automated Diagnostics
Automated Diagnostics
Sending Automation Output to PagerDuty Incidents
Introduction
By default, your automated diagnostics jobs will display their results in logging visible in the Automation interface. There are a few extra steps necessary to transport those logs or some subset over to your PagerDuty incidents. This section will walk you through steps to simplify output in a job and send it to a PagerDuty incident. These steps assume that you have already completed Tour 4: Send Diagnostic Data to PagerDuty, which ensures that you have connected your Automation interface to your PagerDuty instance at the infrastructure level.
Example
To carry out these steps, you’ll need a job that we can modify for our purposes. Since most of the jobs in this Solution already have these steps completed, we’ll start with a fresh job which you can import and work with. You can copy the job definition at the bottom of the page.
- In the Jobs section of your project, click New Job
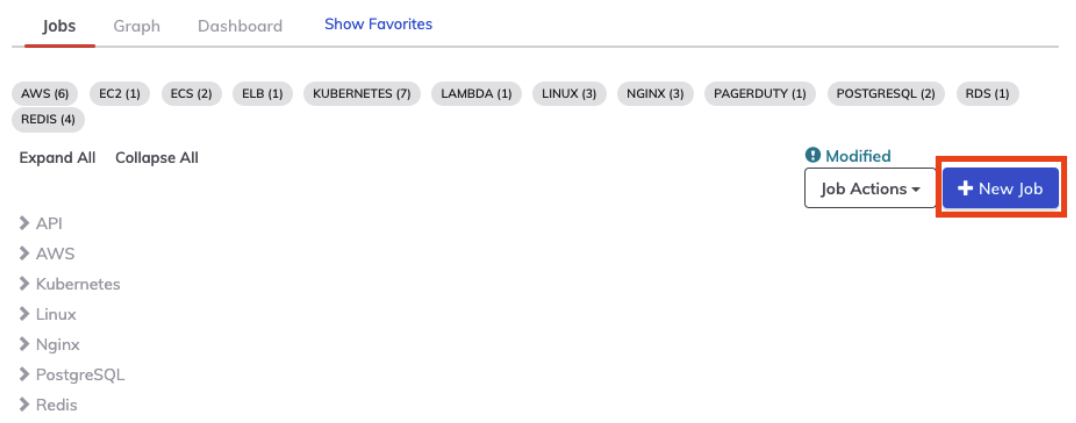
- Click Upload Definition
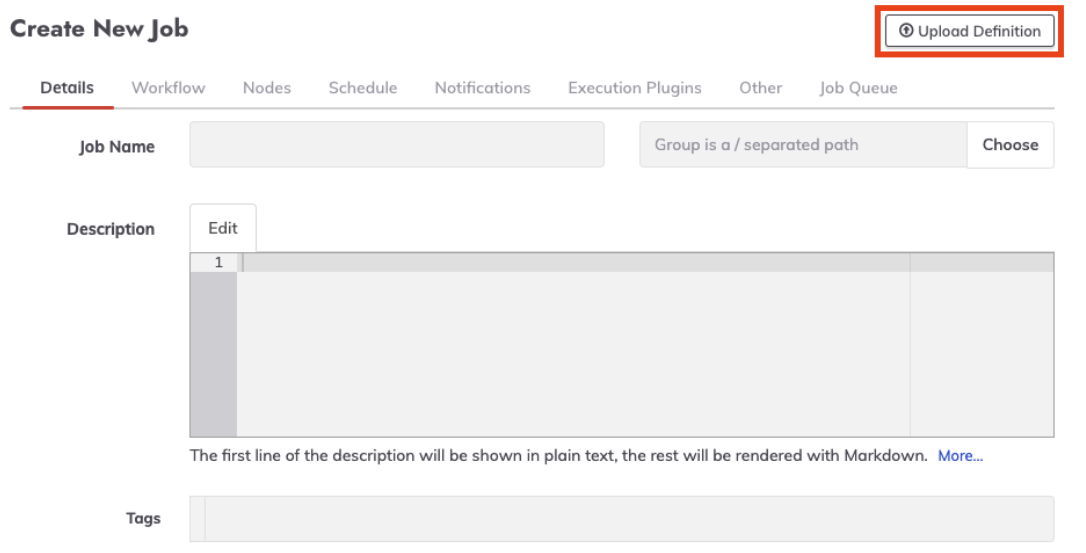
- Click Choose File to select the downloaded file
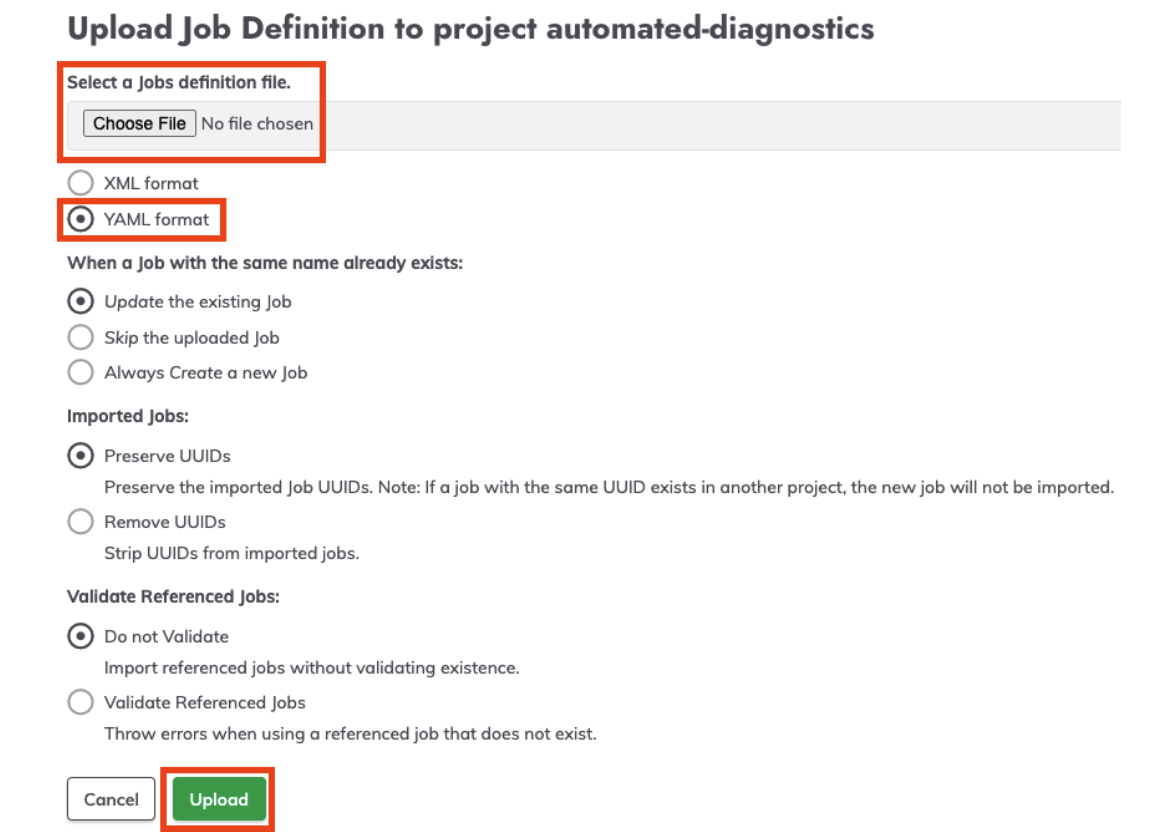
- Select YAML format
- Click Upload
- Edit your job using the Actions menu at the far right of the jobs list.

Add an option for Incident ID
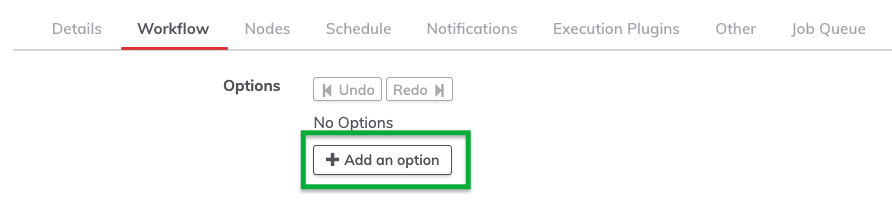
- Click Workflow at the top of the Job Edit page
- Toward the top of the Workflow section, click Add an option.
- Enter an Option Name and Option Label as specified in the screenshot.
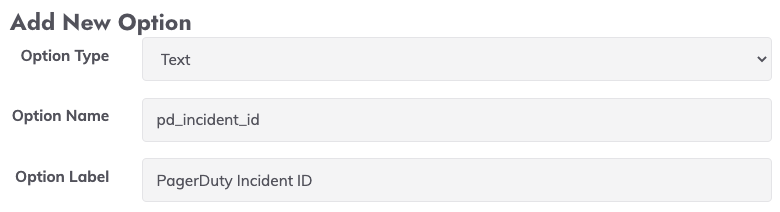
- Click Save for this option
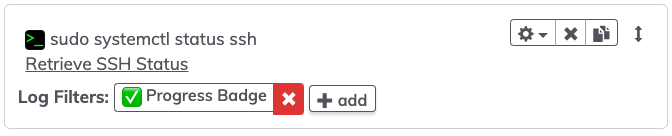
Add a log filter to your job step
- Using the gear icon at the right of the job step, click Add Log Filter
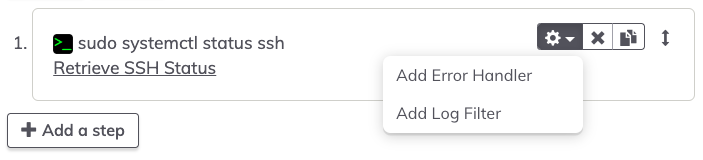
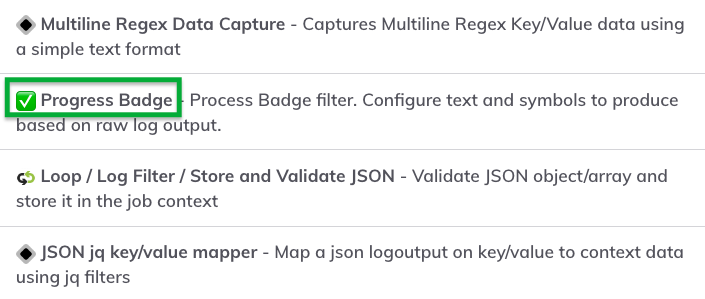
- Choose Progress Badge from the available filters
Setting your Filter
- Set the following fields:
Regex:.*Active: active.*
Text: Healthy
Status Symbol: Select the Green Checkmark
Context Variable: ssh-status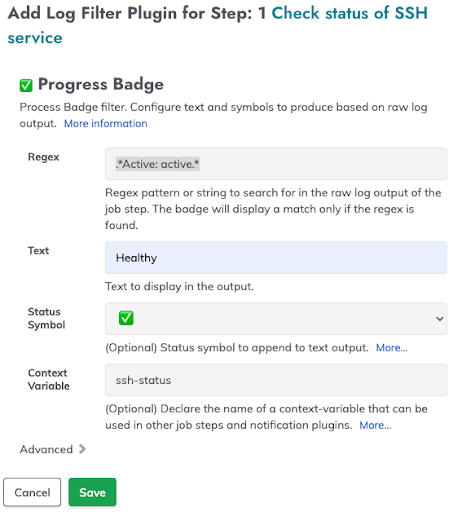
- Save your filter. You should see the log filter visually now as part of your job step.
- Click the +Add button to add another Progress Badge filter
- Set the following fields:
Regex:!.*Active: active.*
Text: Unhealthy
Status Symbol: Select the Red X
Context Variable: ssh-status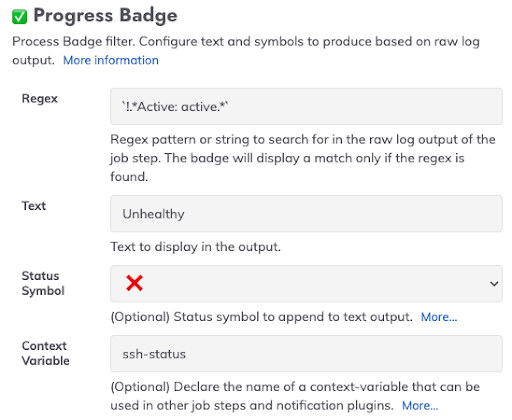
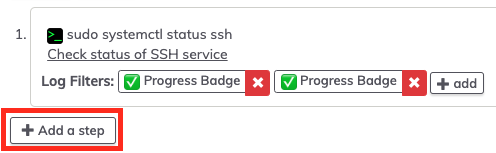
Add an Incident Note job step
- On the Edit Job page, click Add a step.
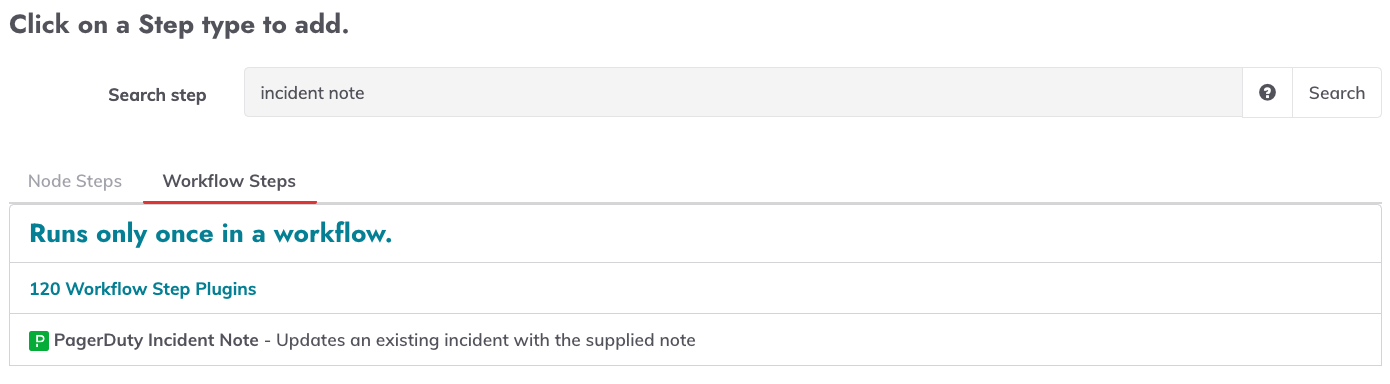
- Under Workflow Steps, search for and select PagerDuty Incident Note
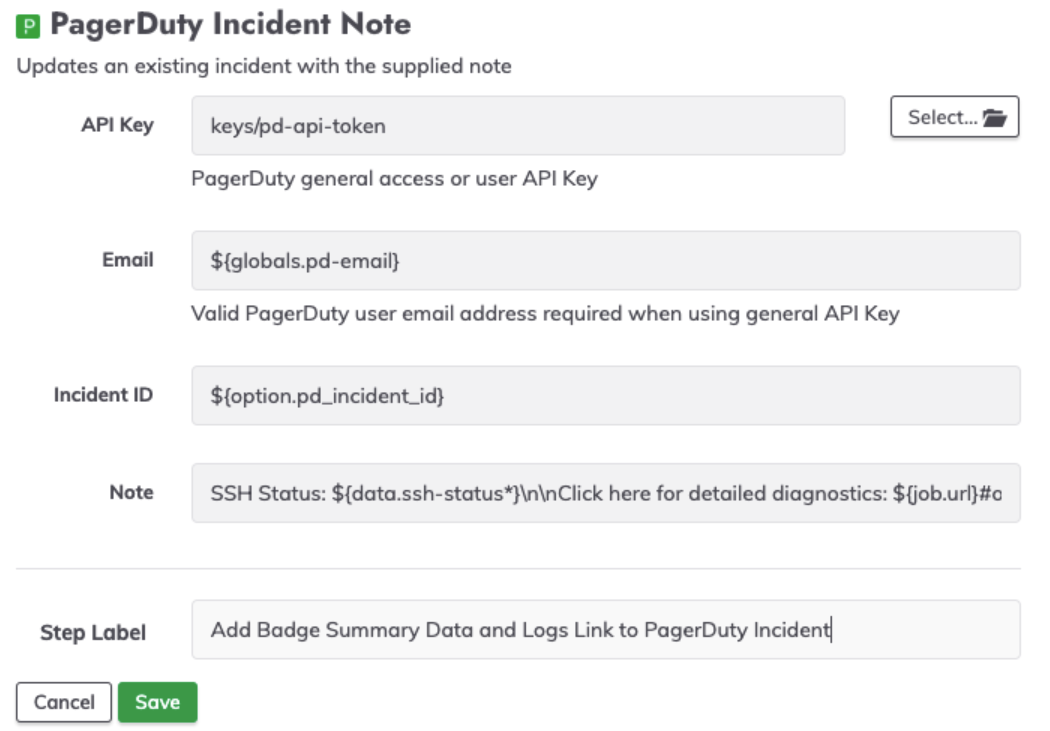
Configure the Incident Note job step
- Enter or select a PagerDuty API Key
If in keystore, use Select button. Otherwise, you can paste the API Key in this field - Enter an Email to be used for incident updates. If you’ve established a project variable, you can use that as specified in screenshot
- Update the Incident ID field as specified in screenshot to use the pd_incident_id variable
- Update the Note field to include variable reference (
${data.variablename}) as shown in screenshot.This note will show the resulting progress badge as well as a link to the full logSSH Status: ${data.ssh-status*}\n\nClick here for detailed diagnostics: ${job.url}#output - Set a Step Label to identify what this job step does
- Save the job step and job to save your changes
Job Definition
Copy and paste this content into a file and import to your project.
- defaultTab: nodes
  description: ''
  executionEnabled: true
  group: Administration/Linux
  id: e4b9f6db-efda-43a4-8f10-52eba1b6c56d
  loglevel: INFO
  name: SSH Status
  nodeFilterEditable: true
  nodefilters:
    dispatch:
      excludePrecedence: true
      keepgoing: false
      rankOrder: ascending
      successOnEmptyNodeFilter: false
      threadcount: '1'
    filter: 'name: employees_mysql_db_1 '
  nodesSelectedByDefault: true
  plugins:
    ExecutionLifecycle: {}
  scheduleEnabled: true
  schedules: []
  sequence:
    commands:
    - description: Check status of SSH service
      exec: sudo systemctl status ssh
    keepgoing: false
    strategy: node-first
  uuid: e4b9f6db-efda-43a4-8f10-52eba1b6c56d