
Automated Diagnostics
Automated Diagnostics
Translating & Simplifying Diagnostic Data
Why simplify diagnostic output?
With PagerDuty Runbook Automation, it is possible to provide very granular diagnostic data. However, granular logs are often not what is needed by an initial responder in the incident response process. Granular data is often not actionable without a lot of specialized knowledge. Consequently, many organizations will provide simplified diagnostic “highlights” as part of their diagnostic jobs, to make it easier for the first responders to determine the next step without having to do a lot of interpretation.
For example, a common diagnostic job might be grabbing logs related to a web server. A specialist who knows the web server might be able to easily look at the full log or log snippets and know what to do but a first responder would need to check a lot of notes or wikis to know how to interpret and take action. By using progress badges in the diagnostic job, it is possible to call out specific errors with text and emoticons to make it easier to interpret current status. The text associated with each badge could even indicate what to do for each error.
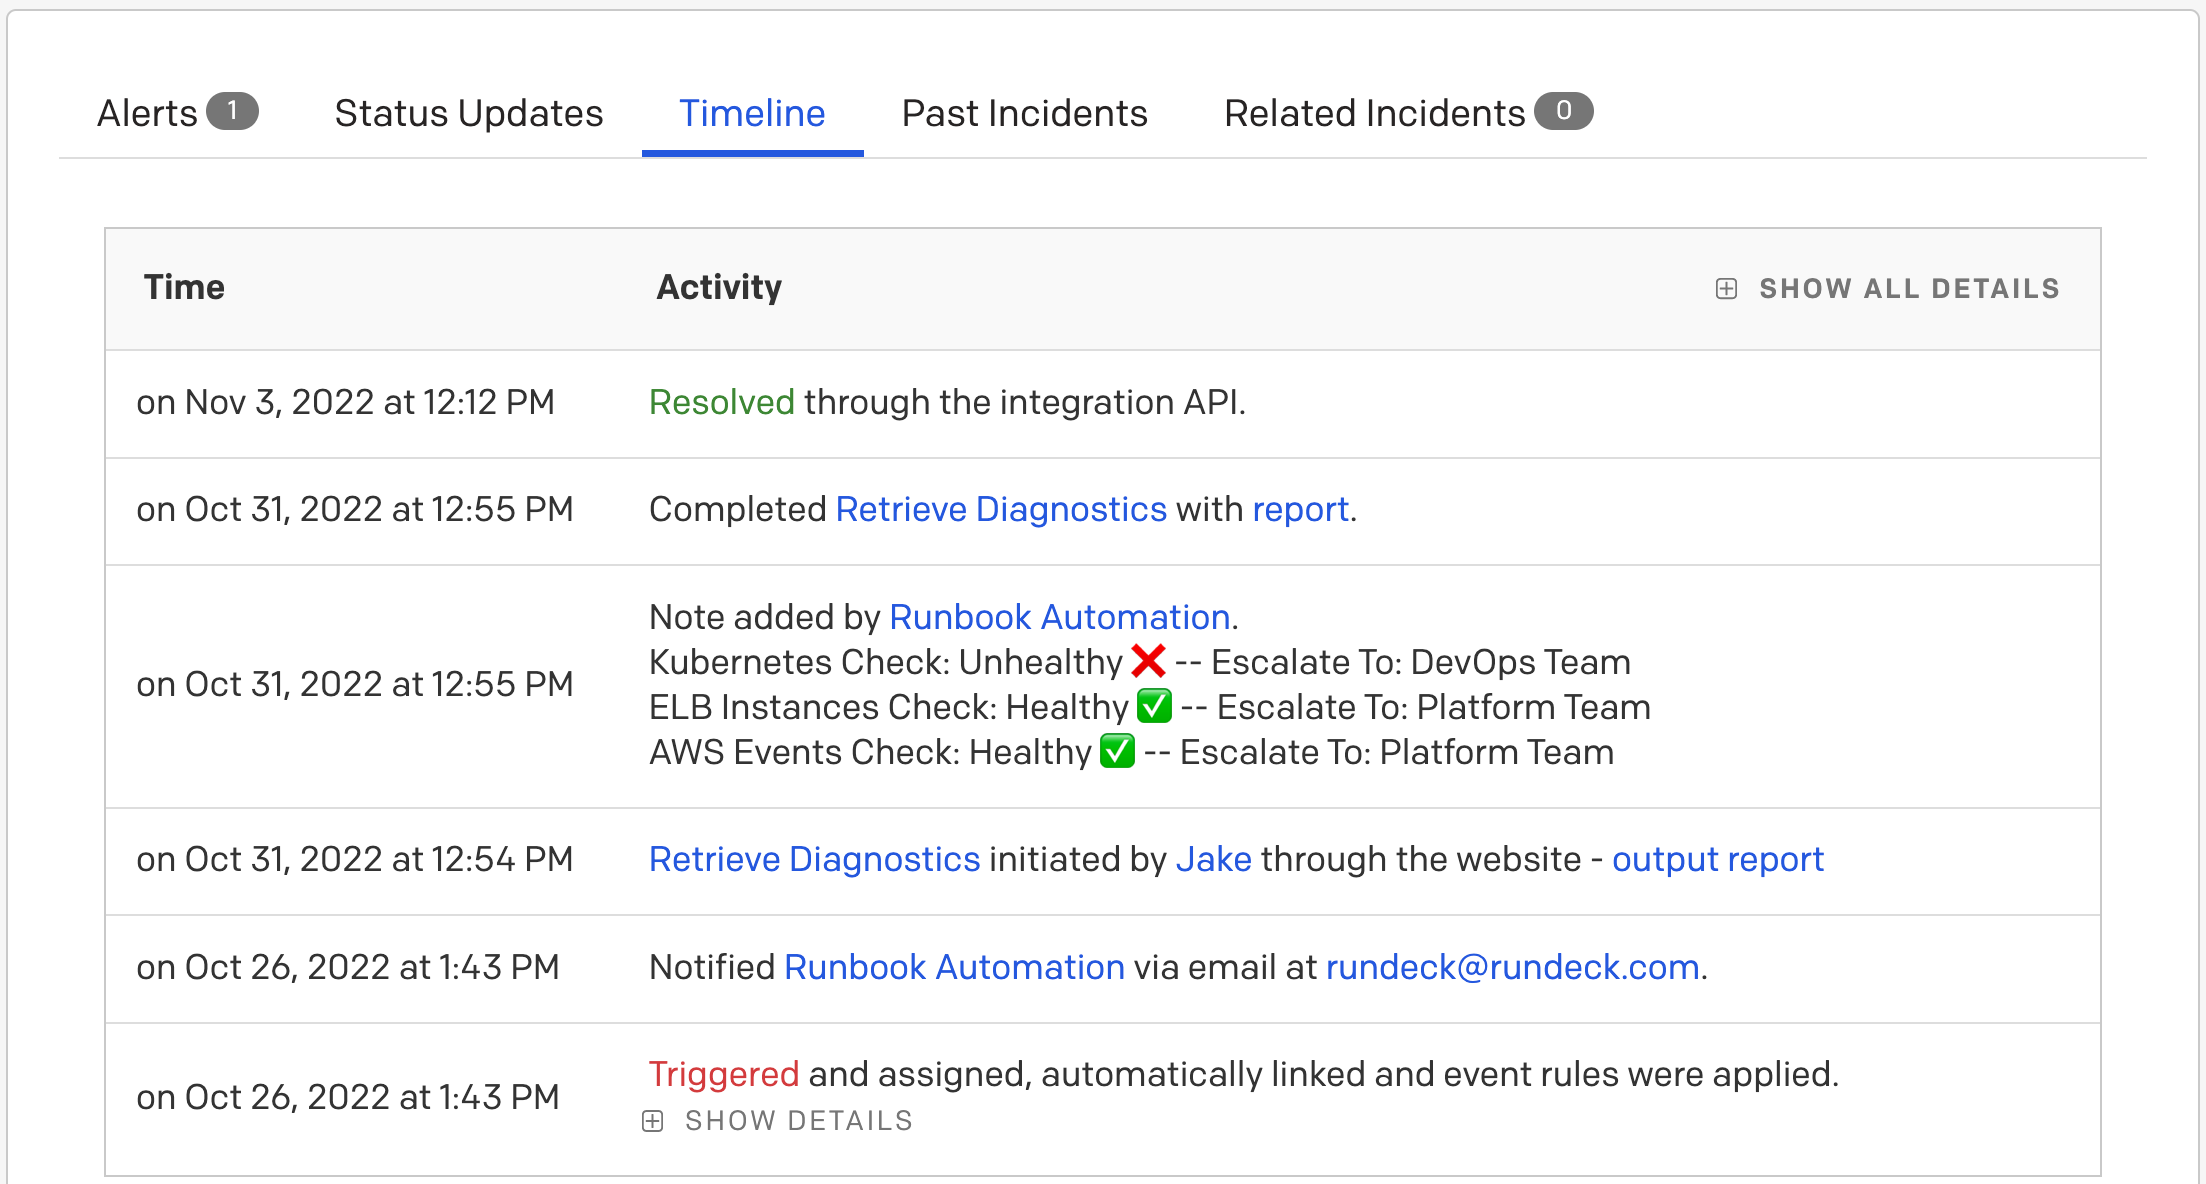
Ideally, simplified diagnostics provides something like a table of results showing status of different pieces of an app stack, each marked with either a green or red icon. This allows the first responder to know that the focus should be on any components that show red. This eliminates pulling in a whole group of folks to each run their own initial diagnostics. Instead, the first responder can pass the baton or take action themselves as appropriate, on an accelerated timeline.
How to simplify diagnostic output
Simplifying diagnostics can be broken down into a few related phases:
- Generate granular diagnostic logs The details of your diagnostics are dependent on what application(s) are being checked and what is considered important. Before trying to simplify, begin by making sure that logs show all data that might be important.
- Using progress badges or other log filters, narrow in on clear metrics that show success or failure of status checks Log filters are a feature you can apply to job steps that may transform or process output from job steps, including adding simplifying metadata that can be exposed in related incidents. Progress badges are the easiest log filter type to use in this case because they are easy to set up to include emoticon data which helps with the visual simplification. Depending on your needs, you might also use the filters to capture Key Value Data, Highlight Output or capture Multi-Line Regular Expressions.
- Add an Incident Note step to the diagnostic job that posts summary data, including badges, back to the initial incident.
The incident note needs to include the context variables created in the log filter from phase 2 above as well as a reference to the source incident and an email address that will be used on incident updates.
For step-by-step instructions, check out our instructions for sending diagnostic data to PagerDuty incidents.