Automated Diagnostics
Automated Diagnostics
Databases
Designing and building databases for today's modern applications is difficult and bugs can be hard to reproduce for the following reasons:
High Concurrency: Potentially millions of users may be accessing and updating records simultaneously.
Lack of Emulating Production: It is difficult to replicate the exact sequence events generated by the end user and the data that existed on the database at the time of the incident.
Log Levels: It is common practice to not log at the "debug level" in production.
Using Automated Diagnostics can help with debugging database issues experienced in production by gathering as much information as possible when an incident occurs.
Examples
Top SQL Consuming Queries
Quickly determining what the top resource-consuming queries are is a standard first-step to identifying the root-cause of any database issues.
Blocking Locks
Blocking locks can quickly stall key applications.
Increased Object Sizes
Check to see if the size of any database objects has spiked in size.
Missing Indexes
This can lead to disk performance problems and more deadlocks than usual.
Inadequate Storage
Databases grow over time - either gradually or with sudden jumps in size. It is common practice to validate that the database has plenty of disk space.
Transaction Logs
An unpredicted jump in transaction load can put strain on the transaction log system and produce issues with archived logs. Diagnostics here would be to check that the logs are sized correctly for the transaction throughput.
Mechanisms for Automated Diagnostics
Runbook Automation provide the following mechanisms that make it easy to automatically diagnose database-related incidents:
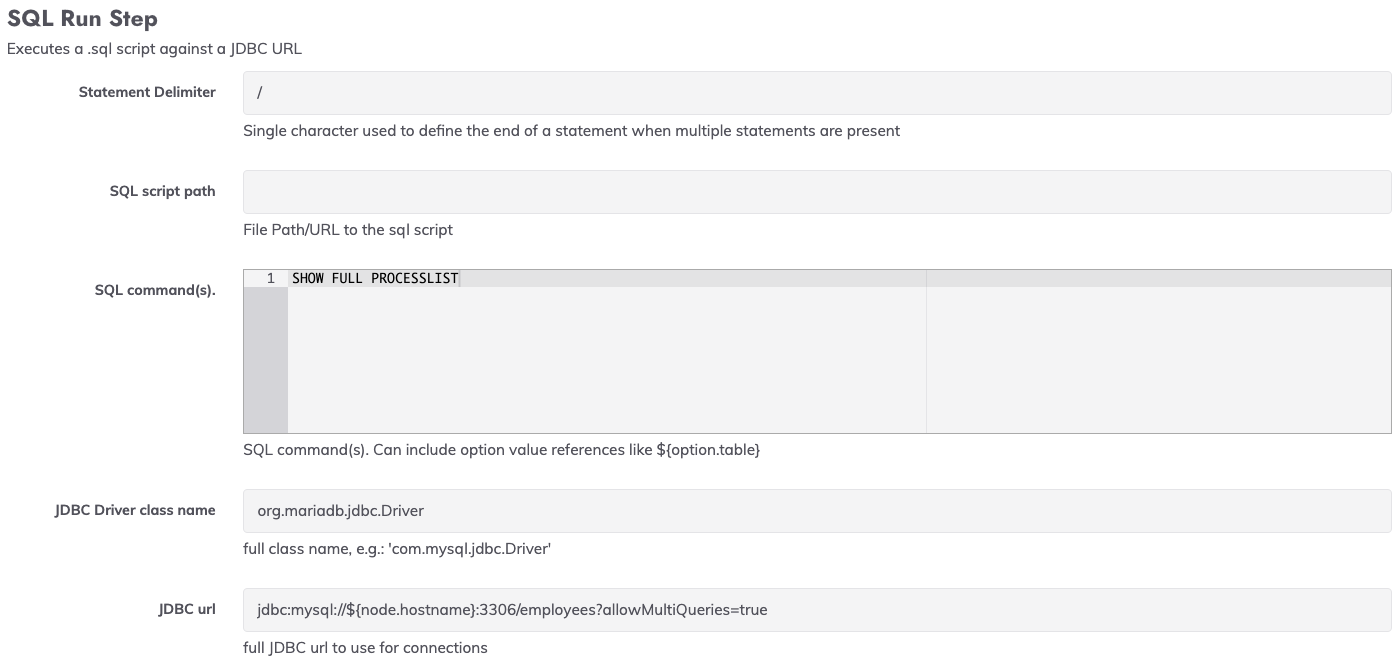
SQLRunner Plugin: The SQLRunner plugin is a node step that can execute a .sql script against a database endpoint. This provides a way to get vital diagnostic information directly from the live database.
For example, using the SHOW FULL PROCESSLIST; will show the running queries, their associated state and duration:
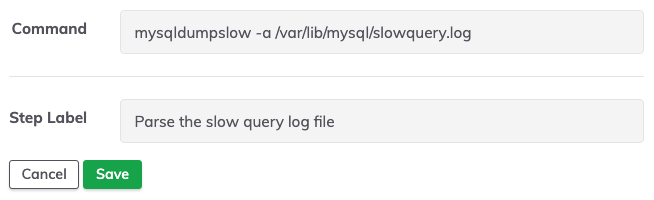
Query services and logs on the database’s host node: In many environments, the database is a service running on a Linux or Windows server. Through node steps, it is possible to run commands to get status information about the database service.
For example, you can query the MySQL Slow Query log file to parse long queries and group similar queries together: