
Monitor a Rundeck Instance Using Prometheus and Grafana (legacy exporter)
Monitor a Rundeck Instance Using Prometheus and Grafana (legacy exporter)
Deprecated in Rundeck 6.0
Rundeck 6.0 exposes metrics natively in Prometheus format at the /monitoring/prometheus endpoint, so the third-party rundeck_exporter described on this page is no longer required for new deployments. Point Prometheus directly at /monitoring/prometheus instead. See the Monitoring overview and Using monitoring data for the modern approach.
This page is retained for users running older Rundeck versions or who already depend on the community exporter. For Runner-specific metrics, see the Runner Metrics Reference.
Using Rundeck metrics users can monitor the health of any Rundeck instance (workload, CPU usage, memory amount, scheduled jobs, running jobs, etc). Some users find it helpful to display these metrics on a dashboard. Using a combination of Prometheus, Grafana, and a custom Prometheus exporter (rundeck_exporter) these metrics can be shown on a dashboard for a glance viewing.
The Rundeck Community team has developed an easy way to see how the Rundeck, rundeck_exporter, Prometheus, and Grafana integration works using this Docker demo project. In this article, we will describe how the Docker demo is configured to help users understand how this integration works.
Prometheus
Prometheus is an open-source monitoring and alerting platform originally created by SoundCloud. Prometheus collects and stores metrics and data from any source.
Grafana
Grafana OSS is an open-source visualization platform. Using Grafana, it’s possible to design custom dashboards to display information in real-time using any data source. These data sources can be a backend database, a file, or as you will see in this article, Prometheus.
Rundeck_exporter project
Rundeck Community contributor, Phillipe Smith, created the rundeck_exporter to monitor the internal behavior of a Rundeck instance. rundeck_exporter is a Prometheus exporter written in Python that takes Rundeck metrics information and displays it in Grafana (through Prometheus).
Find the rundeck_exporter Github repository here.
Rundeck Exporter Demo environment
Download the Rundeck Exporter Demo environment here.
Rundeck Configuration
First, you need an API token belonging to a user who has access to the Rundeck instance metrics. Using the API token, the rundeck_exporter image will take Rundeck metrics and expose them using Prometheus.
In the Docker demonstration project, a static token API called rundecktoken was defined.
In this link you can see how to create an API token. In this link you can see how to create it statically on the tokens.properties file and then referenced on the framework.properties file.
rundeck_exporter Configuration
rundeck_exporter is a Python Prometheus exporter (rundeck_exporter.py) that needs a series of parameters to receive the information from the Rundeck instance and be collected by Prometheus.
The demonstration project uses the following environment variables:
RUNDECK_URLis used where the URL of the Rundeck instance is referencedRUNDECK_TOKENto store the Rundeck token APIRUNDECK_PROJECTS_EXECUTIONSto collect the information of all the executionsRUNDECK_CPU_STATSfor the CPU load statisticsRUNDECK_MEMORY_STATSfor information related to RAM memory load
rundeck_exporter project listens on TCP port 9620 by default.
Prometheus Configuration
On the Prometheus side, a rundeck_exporter reference is needed.
To do this, add the host and port of rundeck_exporter in the prometheus.yaml file located in /etc/prometheus (in the static_config section) as follows:
	static_configs:
  	- targets: ["rundeck_exporter: 9620"]
Here you can see what the complete file looks like.
Prometheus platform listens on 9090 TCP port by default.
Grafana Configuration
First, you need to define the data source in Grafana, in this case, it is Prometheus. The datasources.yml file contains this information, specifically the Prometheus HTTP URL on the datasource section:
url: http://prometheus:9090
this file must go in the /etc/grafana/provisioning/datasources/ path.
Here you can see an example of what it looks like.
It is also necessary to define the dashboard in Grafana, this is done in the rundeck.yml file (in the /etc/grafana/provisioning/dashboards/path), it takes the Dashboard rundeck.json from the filesystem, here is the config line on the dashboard section of the Prometheus data source:
path: /var/lib/grafana/dashboards
Here is the demonstration rundeck.yaml for the full example.
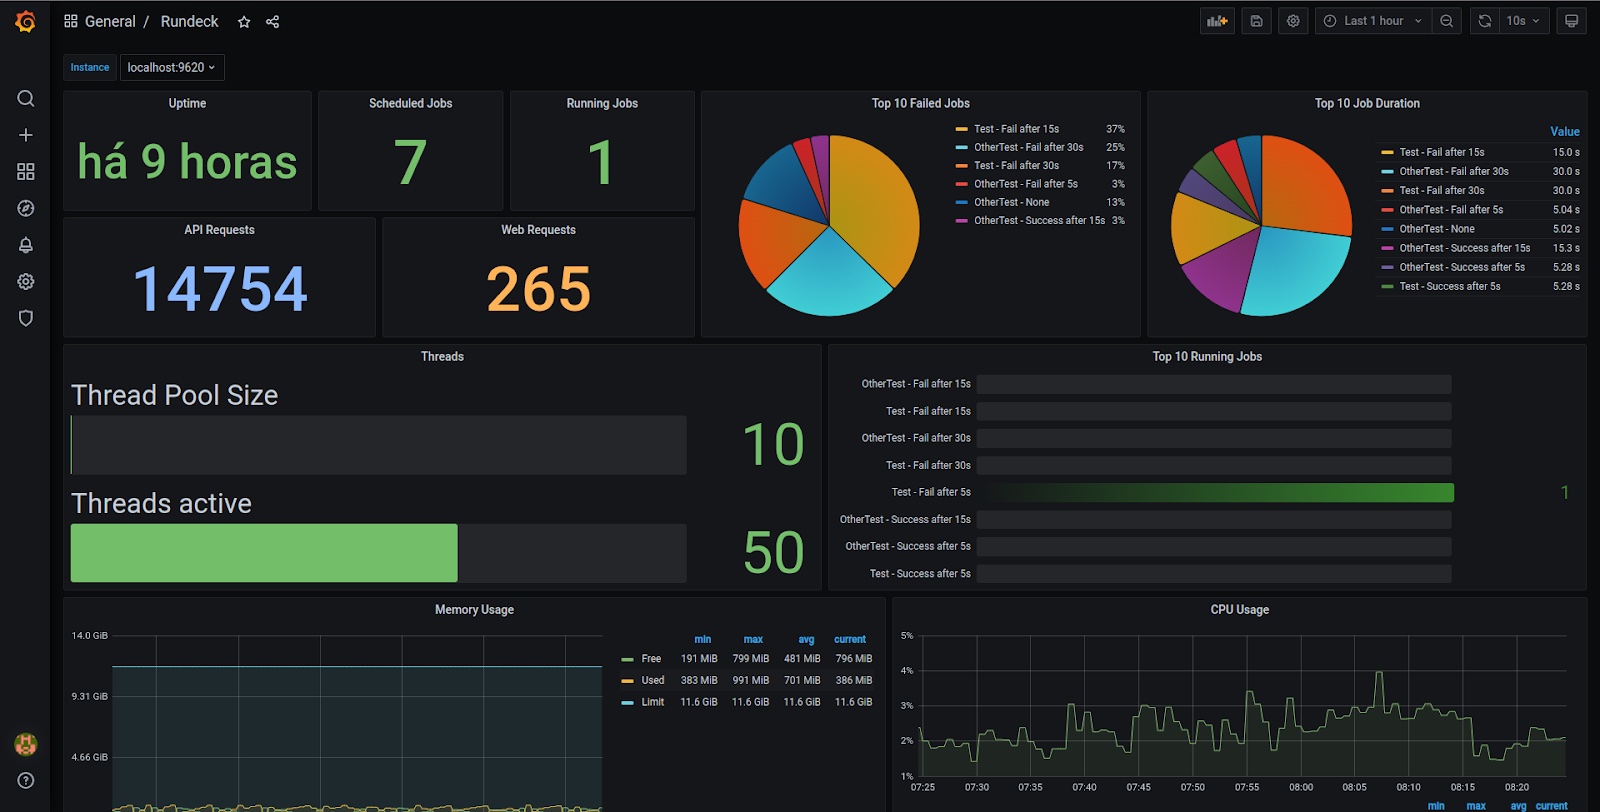
Grafana Dashboard
The final objective of this integration is to be able to see all of the information from the Rundeck instance in a custom dashboard. The definition of Grafana dashboards is in JSON format, usually at the /var/lib/grafana/dashboards path.
The rundeck_exporter project includes a complete dashboard available here, but of course, custom dashboards can be designed.
Grafana listens to 3000 TCP port by default.
Testing the Demonstration environment.
- Clone or download the repository:
git clone https://github.com/rundeck/rundeck-exporter-demo - Go to the cloned repository directory and build the environment with the
docker-compose build, then run withdocker-compose up. - Open the http://localhost:3000 URL in your web browser (user
admin, passwordadmin) and then select the "Rundeck" dashboard. - Open a new tab with the
http://localhost:4440Rundeck URL (useradmin, passwordadmin) and create a new project with a couple of scheduled jobs, and wait for some executions. - If you check the Grafana tab (you will see all Rundeck instance metrics updated on the Grafana dashboard).
Thanks to our community contributor, Phillipe Smith, for creating the rundeck_exporter!