
Status & Monitoring
Status & Monitoring
Runners Status
The status of a Runner is displayed in the Runners page. The following table describes the different statuses:
| Runner Status | Description |
|---|---|
| New | A new Replica has been created for this Runner but has not yet been installed or sent a heartbeat. |
| Healthy | All Replicas for this Runner are sending heartbeats and are available for tasks |
| Unhealthy | At least one or more Replicas are unavailable for Down, but there is still at least one Replicas that is available for tasks. |
| Unknown | All Replicas of the Runner have not sent a heartbeat in over 30 seconds, but have not yet been declared Down. |
| Down | All Replicas of the Runner are declared Down and therefore have not sent a heartbeat in the past 120 seconds. |
Replica Status
The status of Replicas can be seen by navigating to the Replicas tab of the Runner. The status of each Replica is shown in the Last Active column. The status can be one of the following:
| Replica Status | Description |
|---|---|
| New | The Replica has been created but not yet started. Heartbeats are sent from the Replica every 2 seconds. |
| Healthy | The Replica is currently running and available for tasks. |
| Unhealthy | The Replica has connected to Runbook Automation but is experiencing a high workload. This status is set to safeguard the execution times and tells Runbook Automation to utilize another Replica - if available. |
| Unknown | The server has not heard from the Replica in 30 seconds. Tasks will not be assigned to this Replica. |
| Down | The Replica has not been heard from in 120 seconds. Tasks will not be assigned to this Replica. |
Tuning Replicas
Replicas are equipped to execute multiple tasks concurrently - such as executing multiple Job simultaneously or targeting multiple nodes within a Job in parallel. By default, a Replica can handle 50 concurrent task executions.
- An Unhealthy status for a Replica is declared when that Replica can not longer accept new tasks because it has reached the concurrency threshold. You can check the number of concurrent operations via the API endpoint Get runner information under the variable runningOperations
- The maximum number of concurrent executions can be tuned using the parameter
-Drunner.operations.maxRunning=<EXEC_LIMIT>when deploying a Replica. However, please note the following:- The execution limit is linked to the available resources set for the Replica process. Although a maximum number of executions can be established via this parameter, the Replica will throttle the number of executions based on the available resources (CPU, Memory, Stack Memory and Heap Space in Java) as well as the number of tasks associated with that execution.
- It is recommended to review the allocated resources to the machine and the Replica process when it is reporting as Unhealthy. While Replicas can be scaled vertically by allocating additional compute resources to the Java process, note that the Runner feature is intentionally designed to scale horizontally by deploying additional Replicas.
Ping Replicas
Users can check that a Replica is available via an ad hoc "ping" operation:
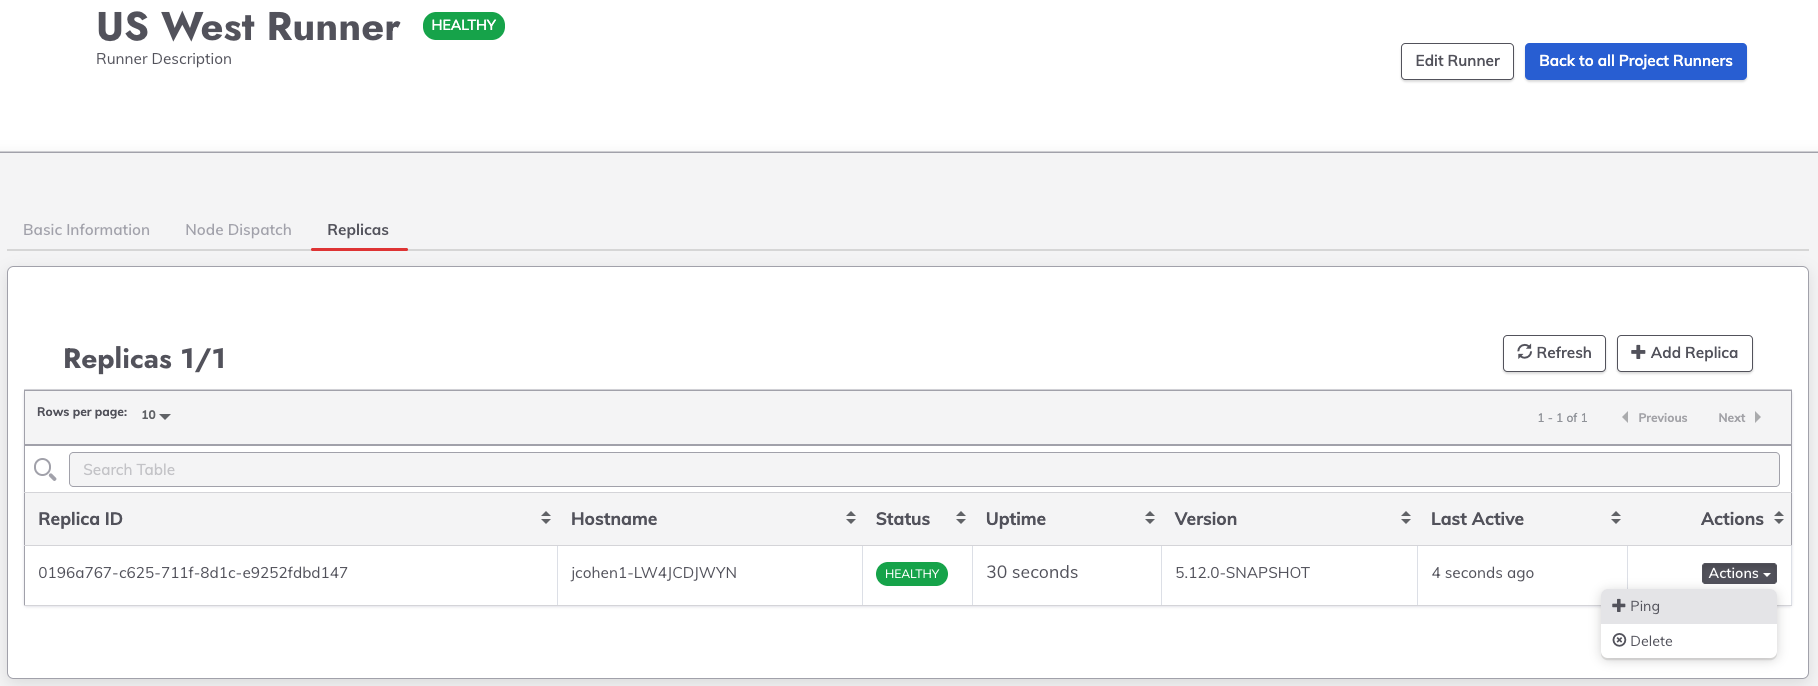
- When managing a Runner - either at the Project or System level - click on the Replicas tab.
- Select the Actions menu and click on + Ping:
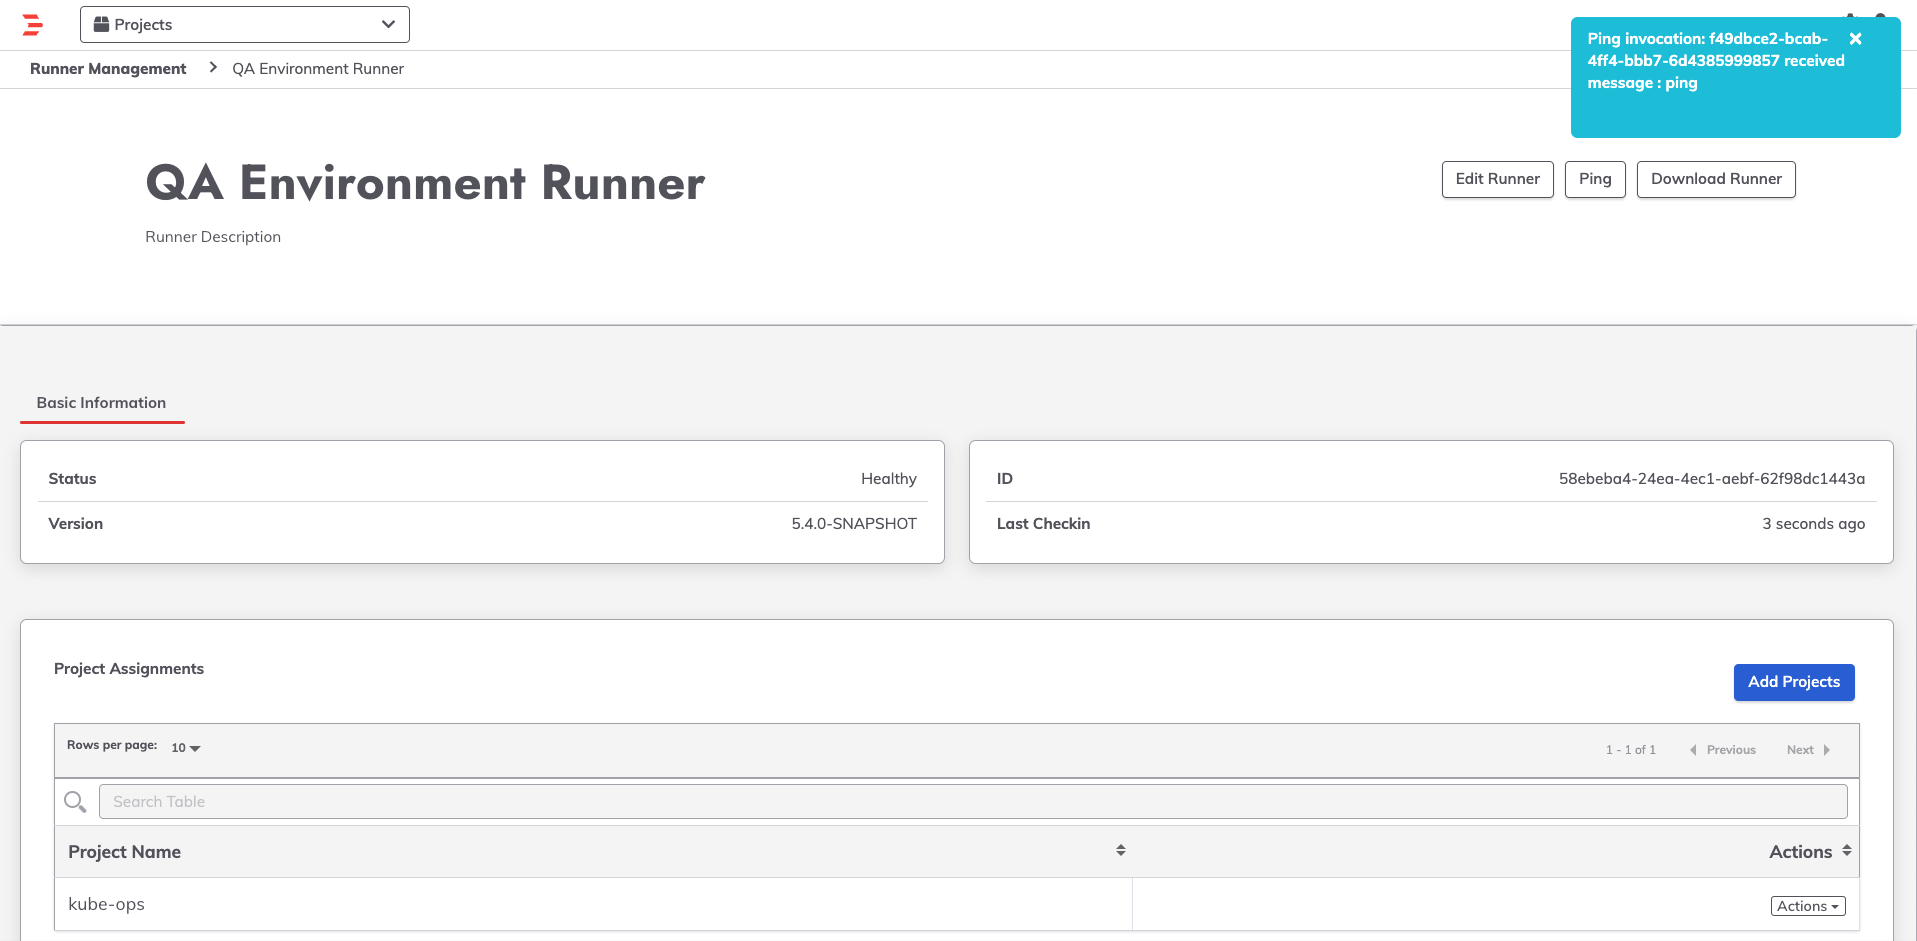
- After a few seconds, the response will appear in the upper right.
- If the Runner is available, the response show that the message was received:
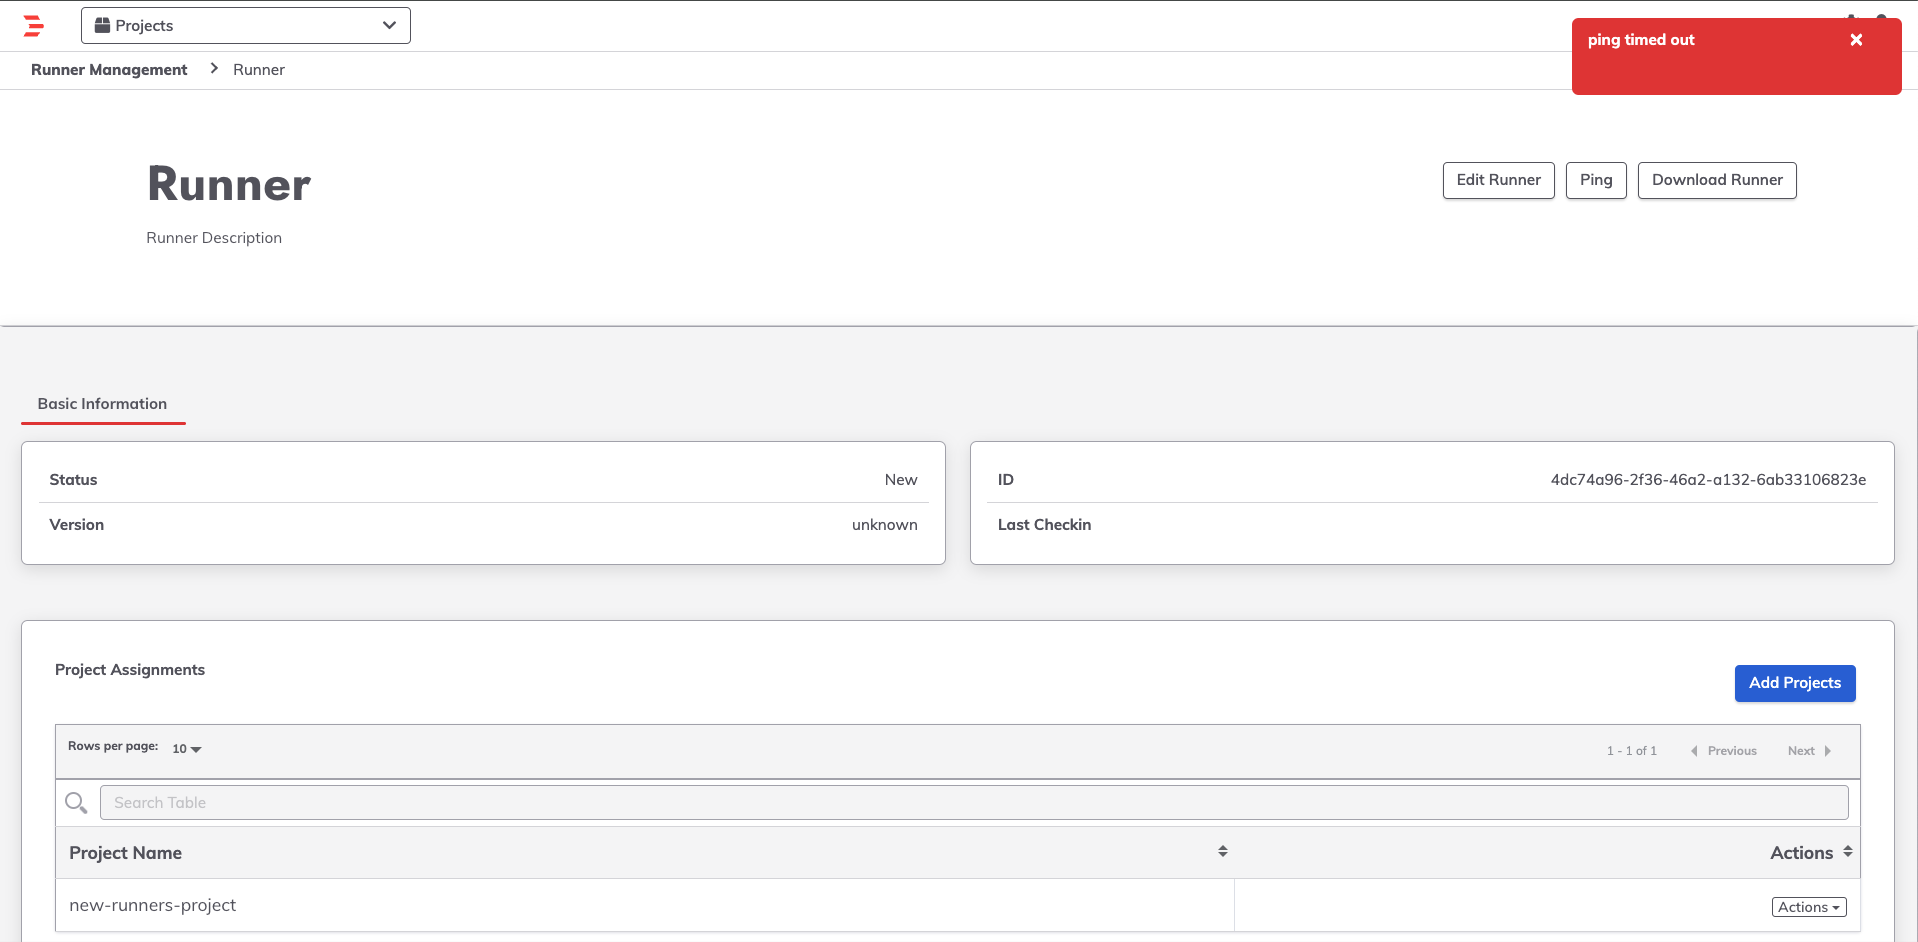
- If the Runner is unavailable, the response will show that the ping response timed out:
Monitoring Replicas
The Enterprise Runner is a lightweight JVM process. It can therefore be monitored with standard JMX monitoring tools.
The Replica exposes a number of JMX MBeans that can be used to monitor the Replicas's health and performance.
To expose the JMX Mbeans, you can start the Replica with the following Java options:
-Dcom.sun.management.jmxremote- This enables remote JMX monitoring.-Dcom.sun.management.jmxremote.port- This sets the port that the JMX Mbeans will be exposed on.-Dcom.sun.management.jmxremote.authenticate- This enables or disables authentication for the JMX connection.-Dcom.sun.management.jmxremote.ssl- This enables or disables SSL for the JMX connection.-Djava.rmi.server.hostname- This sets the hostname that the JMX Mbeans will be associated with.-Dcom.sun.management.jmxremote.local.only- This enables or disables local-only access to the JMX Mbeans.
For example, to start the Runner with JMX monitoring enabled on port 9010, you would use the following command:
java -Dcom.sun.management.jmxremote \
  -Dcom.sun.management.jmxremote.port=9010 \
  -Dcom.sun.management.jmxremote.local.only=false \
  -Dcom.sun.management.jmxremote.authenticate=false \
  -Dcom.sun.management.jmxremote.ssl=false \
  -Djava.rmi.server.hostname=localhost \
  -jar runner-6281cf48-37a2-4659-93c9-907539177022.jar
Once the Runner is running with JMX monitoring enabled, you can connect to it using a monitoring tool.
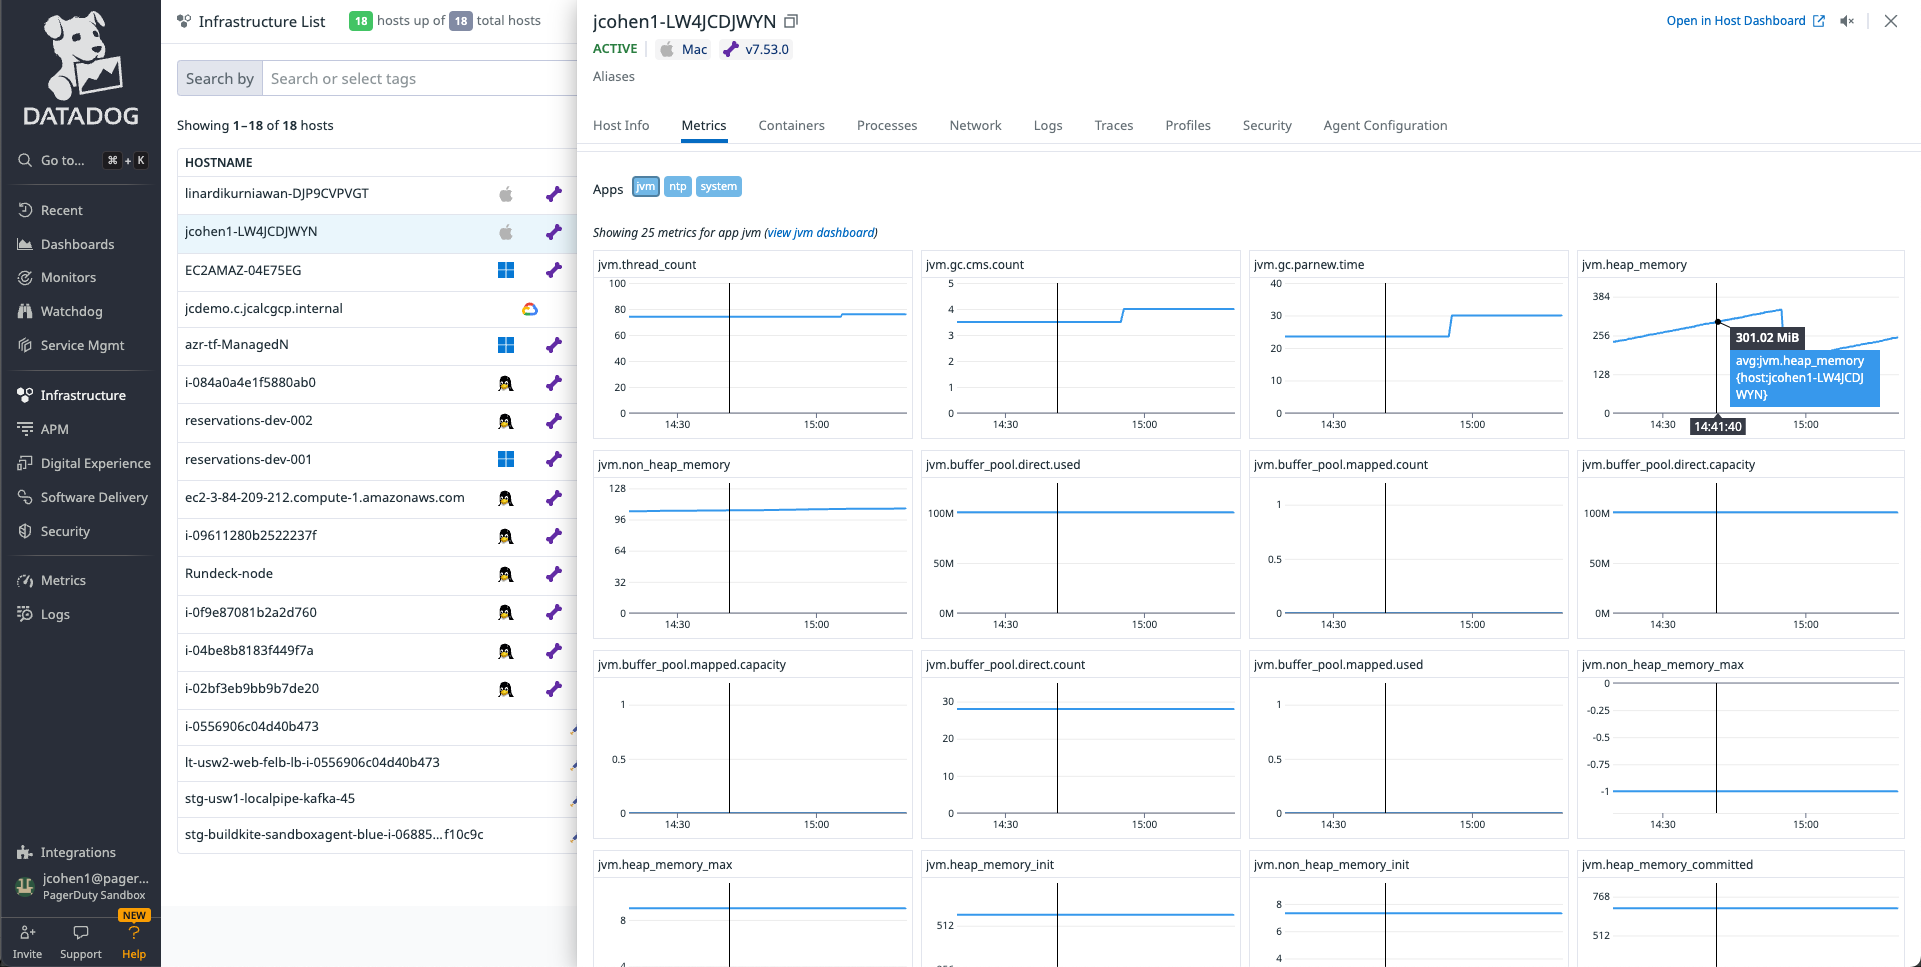
For example, the Datadog agent can be configured to monitor the Runners JVM metrics following these steps.
The JVM metrics will then be associated with the Runner's host in Datadog:
Operation and report-delivery metrics
Rundeck 6.0 adds operation-queue and report-delivery metrics that help diagnose and predict the server-side Runner did not deliver reports in the configured timeout period error. On the Replica these are exposed through the same JMX MBeans described above — no extra configuration beyond enabling JMX is required.
The Replica does not expose an HTTP metrics endpoint and does not bind to a network port for monitoring. To consume the Runner metrics with Prometheus, attach the jmx_prometheus_javaagent as a Java agent and point it at a JMX config:
java -javaagent:/path/to/jmx_prometheus_javaagent.jar=9404:/path/to/jmx-config.yml \
  -jar runner-6281cf48-37a2-4659-93c9-907539177022.jar
The agent then exposes the JMX MBeans (including JVM and Runner metrics) in Prometheus format on its own port (9404 in the example above).
The Runner-side metrics are only part of the report-delivery picture; the matching server-side metrics are exposed on the Rundeck server's /monitoring/prometheus endpoint. For the full list of metrics across both processes and guidance on interpreting them, see the Runner Metrics Reference.