Enable Diagnostics for RabbitMQ
Enable Diagnostics for RabbitMQ
When troubleshooting RabbitMQ servers or containers, gathering relevant logs, system-level metrics and environment information can provide valuable insights into the overall state of the node.
To streamline this process, the RabbitMQ team has developed an official support tools repository. This repository contains the "rabbitmq-collect-env.sh" shell script that collects RabbitMQ-specific logs, along with selected OS logs and system-level metrics, to aid in debugging and diagnosing issues.
In this how-to, we will explore how to effectively use the "rabbitmq-collect-env.sh" script and integrate it into a Rundeck job for debugging RabbitMQ servers/containers.
What is RabbitMQ?
RabbitMQ is an open-source message-broker software that allows applications to communicate with each other using messaging protocols. It is a message queuing system that enables different applications or services to asynchronously exchange messages or data in a decoupled manner.
RabbitMQ supports several messaging protocols, including Advanced Message Queuing Protocol (AMQP), Streaming Text Oriented Messaging Protocol (STOMP), Message Queuing Telemetry Transport (MQTT), and others. It also provides features such as message routing, reliable message delivery, message acknowledgments and message queuing, which make it a robust and scalable solution for building distributed systems.
In RabbitMQ, messages are sent to a queue by a producer and then consumed by one or more consumers. Consumers can subscribe to a specific queue or set of queues and receive messages as they arrive. RabbitMQ also supports message exchange patterns, such as direct, topic, fanout, and headers, which allow for more complex message routing scenarios.
RabbitMQ can be used in various scenarios where different applications or services need to communicate with each other asynchronously. Some common use cases for RabbitMQ include:
Microservices architecture: RabbitMQ is often used as a messaging layer in microservices architecture to enable communication between different microservices.
Event-driven systems: RabbitMQ can be used in event-driven systems where different components need to react to events or changes in the system.
You can learn more about RabbitMQ here.
Debugging RabbitMQ through Rundeck Job
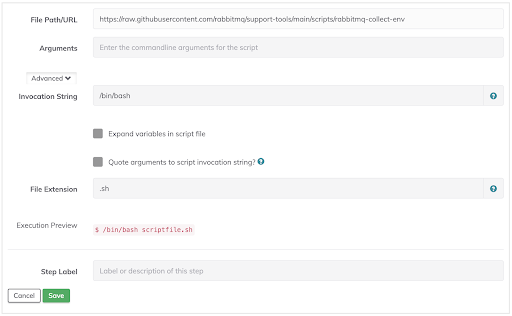
This example uses the "rabbitmq-collect-env.sh" script, an open-source tool provided by the RabbitMQ team. It gathers RabbitMQ logs, selected OS logs, system-level metrics (such as iostat and kernel limits) and other environment information. While some of this data may not be directly related to RabbitMQ, it can offer additional insights into the overall state of the node and assist in troubleshooting.
Using this Rundeck workflow, you’ll work through the following steps:
- Run the rabbitmq-collect-env script on the RabbitMQ server:
To debug a RabbitMQ server/container, executes the "rabbitmq-collect-env.sh" script on the target node. The script gathers various logs and environment information and creates a compressed archive file for analysis.
- Analyze the collected data:
Once the "rabbitmq-collect-env" script completes, you will have a compressed archive file containing all the gathered logs and environment information. - Extract the archive:
Analyze the contents using tools or techniques appropriate for your debugging requirements. Pay attention to RabbitMQ-specific logs, system metrics, and any anomalies that might point to a root cause.
- Send the compressed file to a file server:
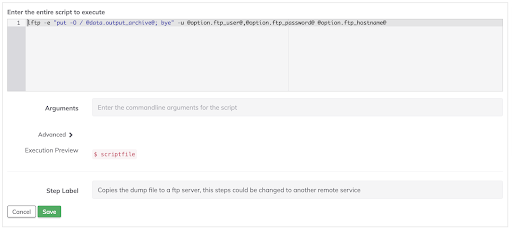
The compressed file is posted to an FTP service and all the data generated in step 4 is sent to an external web service as a notification.
- Clean up the Rabbit MQ server:
The compressed file is deleted from the RabbitMQ server.
So, the following job definition achieves this workflow:
- defaultTab: nodes
 description: |-
   A Job example that collects data from a RabbitMQ server and puts the dump
   file in a FTP server and notifies about the relevant information to a
   web service.
 executionEnabled: true
 id: 101f7d6f-a58a-4bfb-a548-7325978eefaf
 loglevel: INFO
 name: CollectRabbitMQData
 nodeFilterEditable: false
 nodefilters:
   dispatch:
     excludePrecedence: true
     keepgoing: false
     rankOrder: ascending
     successOnEmptyNodeFilter: false
     threadcount: '1'
   filter: 'docker:Config.Hostname: rmq'
 nodesSelectedByDefault: true
 notification:
   onsuccess:
     plugin:
       configuration:
         authentication: None
         body: |-
           Operating System Details:

           ${export.rmqos}

           RabbitMQ Data

           ${export.rmqse}
         contentType: application/json
         method: POST
         noSSLVerification: 'true'
         remoteUrl: ${option.webserviceurl}
         timeout: '30000'
       type: HttpNotification
 notifyAvgDurationThreshold: null
 options:
 - hidden: true
   label: FTP Service Hostname
   name: ftp_hostname
   required: true
   value: ftp
 - hidden: true
   label: FTP Service Password
   name: ftp_password
   required: true
   secure: true
   storagePath: keys/ftp_password
   valueExposed: true
 - hidden: true
   label: FTP Service User
   name: ftp_user
   required: true
   value: admin
 - label: Web Service URL
   name: webserviceurl
   required: true
   value: https://webhook.site/xxx-xxx-xxx-xxx-xxx
 plugins:
   ExecutionLifecycle: {}
 scheduleEnabled: true
 schedules: []
 sequence:
   commands:
   - fileExtension: .sh
     interpreterArgsQuoted: false
     plugins:
       LogFilter:
       - config:
           invalidKeyPattern: \s|\$|\{|\}|\\
           logData: 'true'
           name: output_archive
           regex: .*\'(.*)\'.*
           replaceFilteredResult: 'false'
         type: key-value-data
     scriptInterpreter: /bin/bash
     scripturl: https://raw.githubusercontent.com/rabbitmq/support-tools/main/scripts/rabbitmq-collect-env
   - configuration:
       cycles: '1'
       interval: '3'
       progress: 'true'
     description: Wait three seconds
     nodeStep: true
     type: nixy-waitfor-sleep-workflow-node-step
   - description: Uncompress the dump to print some values in the job
     exec: cd /var/log/rabbitmq; tar xvf ${data.output_archive}
   - description: Operating System related data
     plugins:
       LogFilter:
       - config:
           captureMultipleKeysValues: 'true'
           hideOutput: 'false'
           logData: 'true'
           name: os
           regex: (.*)
         type: key-value-data-multilines
     script: |
       echo "#############"
       echo "SERVER HEALTH"
       echo "#############"

       echo ""

       echo "Hostname:"
       cat /var/log/rabbitmq/rmq/system/hostname

       echo ""

       echo "Operating System:"
       cat /var/log/rabbitmq/rmq/system/uname

       echo ""

       echo "Uptime:"
       cat /var/log/rabbitmq/rmq/system/uptime

       echo ""

       echo "VMSTAT data:"
       cat /var/log/rabbitmq/rmq/system/vmstat
   - description: RabbitMQ specific data
     plugins:
       LogFilter:
       - config:
           captureMultipleKeysValues: 'true'
           hideOutput: 'false'
           logData: 'true'
           name: rmq
           regex: (.*)
         type: key-value-data-multilines
     script: |
       echo "#############"
       echo "SERVER HEALTH"
       echo "#############"

       echo ""

       echo "RMQ Environment:"
       cat /var/log/rabbitmq/rmq/rabbitmq/rabbitmqctl_environment

       echo ""

       echo "RMQ Status:"
       cat /var/log/rabbitmq/rmq/rabbitmq/rabbitmqctl_status

       echo ""

       echo "RMQ PID Limits:"
       cat /var/log/rabbitmq/rmq/rabbitmq/rabbitmq_pid_limits
   - description: 'Copies the dump file to a ftp server, this steps could be changed
       to another remote service'
     script: 'lftp -e "put -O / @data.output_archive@; bye" -u @option.ftp_user@,@option.ftp_password@
       @option.ftp_hostname@'
   - configuration:
       export: rmqos
       group: export
       value: ${data.os*}
     description: RabbitMQ Operating System data
     nodeStep: false
     type: export-var
   - configuration:
       export: rmqse
       group: export
       value: ${data.rmq*}
     description: RabbitMQ Service Exported Variable
     nodeStep: false
     type: export-var
   - description: 'Last step: Deletes the dump files from the RMQ Server'
     exec: rm ${data.output_archive}; rm -rf /var/log/rabbitmq/rmq; echo "All done!"
   keepgoing: false
   strategy: sequential
 uuid: 101f7d6f-a58a-4bfb-a548-7325978eefaf
The "rabbitmq-collect-env" script is a valuable tool for debugging RabbitMQ servers/containers. By incorporating it into your troubleshooting process, you can collect relevant logs, system-level metrics, and environment information, aiding in the identification and resolution of issues. Integrating the script with Rundeck further streamlines the debugging workflow, enabling automation and centralized management of RabbitMQ debugging tasks.
Resources
- Rabbit MQ documentation.
- Rabbit MQ support Repository.
