
Executions
Executions
An execution is a representation of the activity of a running or completed command or job. The data about the execution is used in rundeck to monitor the progress of a job or command and later for reporting about what happened.
Each execution contains any output generated by commands or job steps, a record of the nodes where they occurred and the start/end time and status for each step.
Overview
An execution represents the state of a command or job execution. Users can view an execution while it is in one of two states, running or completed. Each execution is identified by an ID and is addressable by a unique URL. You can share this URL to other Rundeck users and all see a common view of the execution.
The Rundeck graphical interface lets you watch the progress of an execution in a number of ways - summary, monitor, log view or status bar - depending on the level of detail you desire.
Jobs can complete either successfully, with a failure, partial success or have been aborted. The execution state consists of metadata about the steps, nodes where steps are running, log output, and any inputs and options the job runner has provided. The state also contains information about start and end time, and who started it.
Besides the graphical interface, it is also possible to view an execution via the API or command line tool.
Difference between Jobs and Commands
Whether executing a job or a command, Rundeck provides a consistent interface to the execution.
There are small differences between the two though and the Rundeck graphic interface indicates this through a few changes to the appearance in the web pages.
Job execution view
Job executions show the Job name and group and display an icon that looks like a book. An Action menu provides actions to modify the job.
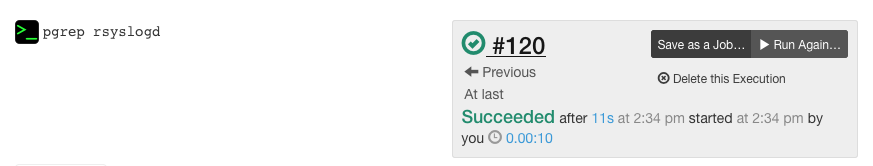
Command execution view
- Command executions display the command string as the execution name and an icon that looks like a terminal command prompt (
>_). - The "Save as a Job..." button offers a user to create a job from the command using the same node filter info and automatically defines the first step of the workflow using the command string.
Summary View
The summary view is the left most tab in the execution page and provides a simplified view of the execution state. The summary view is useful if you have a long running job and it is not important to view detail about its progress nor the log messages.
The summary page displays a box score style table containing counters about node step executions.
Live
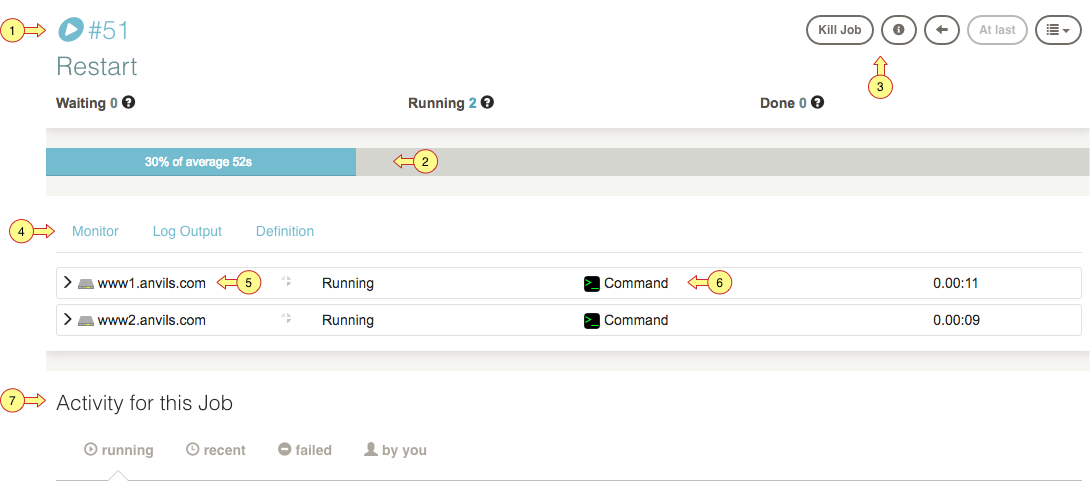
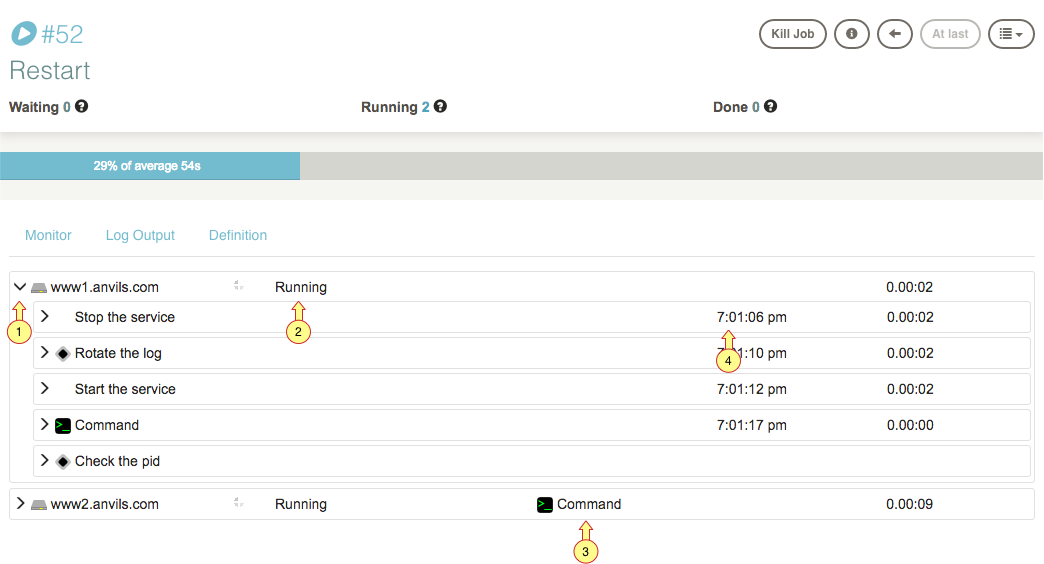
The screenshot below displays the elements of the summary view for a running execution.
- Execution status icon is blue to indicate it is running.
- Elapsed Time progress bar. The average elapsed time is calculated from the previous executions of the job. If the elapsed time is within the average duration, the bar is colored blue. If the elapsed time exceeds the average the bar turns orange.

- Action buttons. Assuming the ACL policy grants it, the execution can be killed.
- Tabs to other execution views besides Summary.
- Box score node summary shows nodes that are waiting to run, currently running steps, or are done running their steps.
- Now Running displays the current node and step that is being executed. The step is a link that will take you to the Monitor view.
- Activity for this job provides historical views to this kind of execution.
Completed
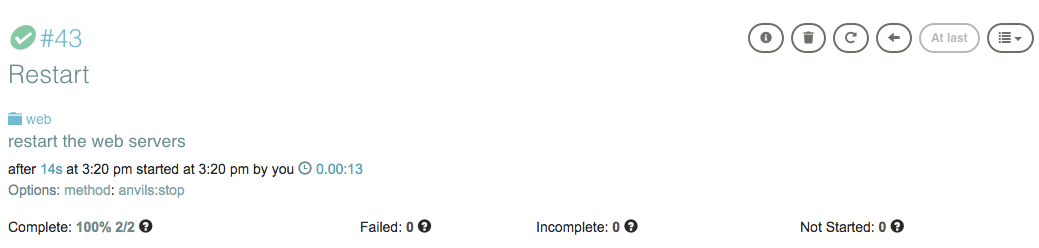
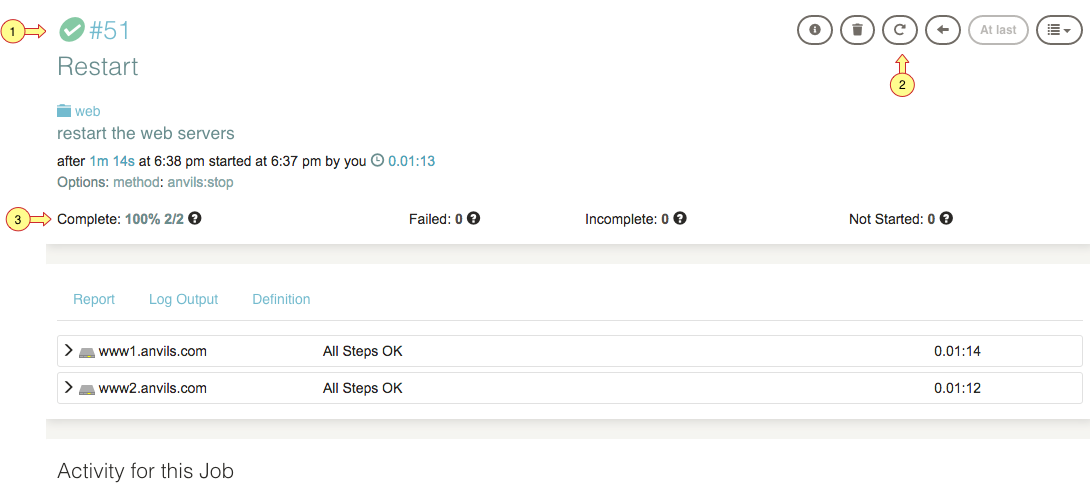
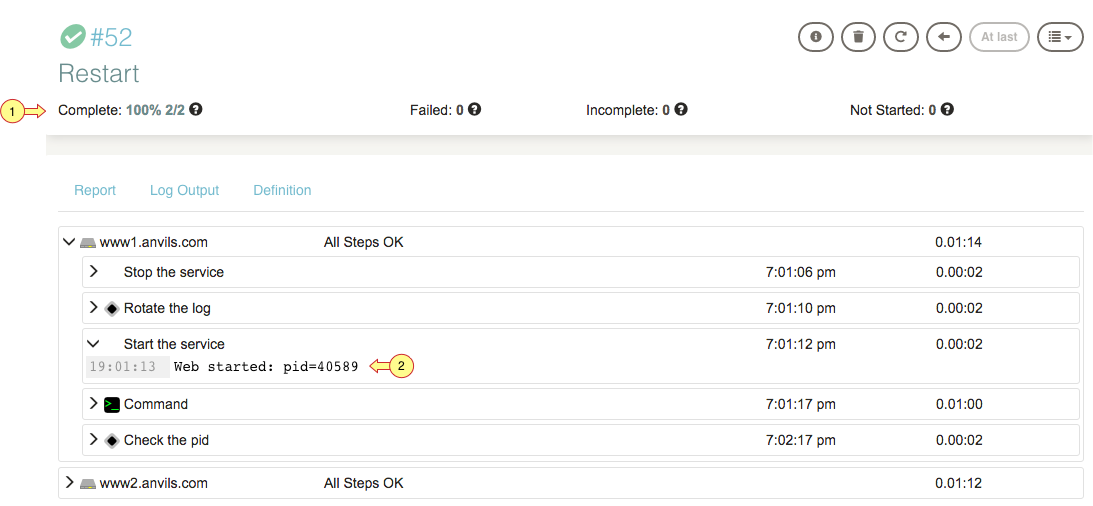
The screenshot below displays the elements of the summary view for a completed execution.
- Execution status icon is green with a check mark to indicate it was successful. Unsuccessful executions are red.
- Action buttons. Press the "Run Again..." button to re-run the execution.
- Box score about executed node steps:
- COMPLETE: number of nodes that ran all steps,
- FAILED: number of nodes with failed steps,
- INCOMPLETE: number of nodes with some steps that were not started,
- NOT STARTED: number of nodes with all steps that were not started.
Monitor And Report Views
Depending on the execution state, you can view the execution by node and step.
Monitor
While the execution is running you can monitor progress organized by node and step. All nodes part of the execution are displayed with their steps shown below. The following screenshot displays the notable aspects.
- Node detail view contains an arrow that when pushed, displays the steps. Clicking on the step will show any output that step generates.
- Step status is shown in the second column. If all steps for that node complete, "All Steps OK " is shown, otherwise you will see "Running".
- The current executing step is shown in the third column.
- Start time and duration are displayed in the right hand columns.
Report
After the execution completes, the Monitor tab name changes to "Report". The Report view is similar to the Monitor view, displaying node and step information.
- Box score about executed node steps as discussed earlier in this document.
- Collated output detail showing information as described in the Monitor view.
Log Output
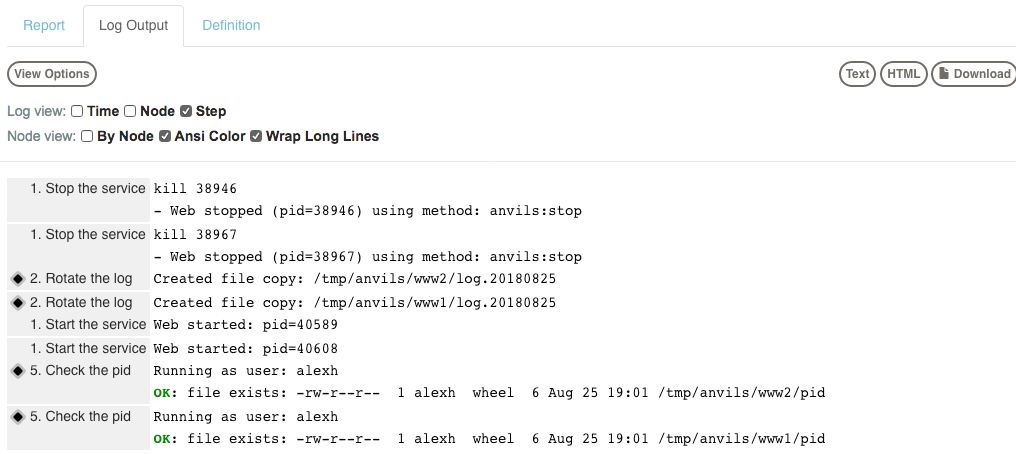
Output generated by the steps are displayed in the "Log Output" tab. While the execution is running, new messages are appended to the end of the view simulating a log tail.
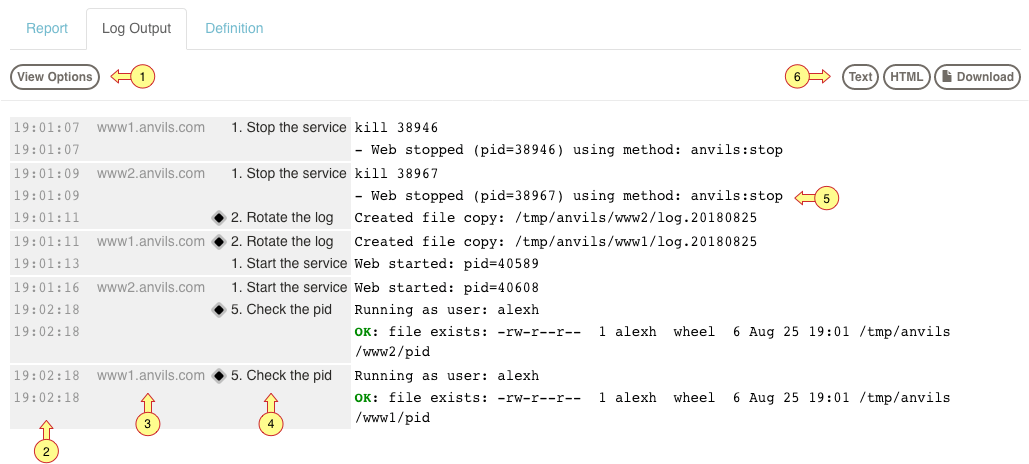
View options
- Click the "View Options" link to reveal the controls. The screenshot above shows the default settings turned on.
- Time Stamp. This is the time the message was read (not the time of execution on the remote server)
- Node Name. This is the Node's name where the step occurred.
- Step Name. This is the step executed on the node. The icon indicates the kind of step. The one shown in the screen shot is a job step (indicated by the book icon).
- Log Message. This is the output generated by the step. Messages written to standard error are displayed in a brownish red color.
- Download links. You can view the Plain Text output, HTML output, or Download the log text.
Ansi Color Mode, if enabled, shows any ANSI-escaped colors in the output text. If disabled, the colors are not shown.
The example below shows a screenshot of just Time and Node information selected.
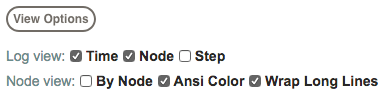
This results in the following display.
Text output
Press the "Text" link to display just the log messages without any execution metadata.
- Web stopped (pid=8685) using method: web:stop
- Web stopped (pid=8928) using method: web:stop
- Web started (pid=15088)
- Web started (pid=15331)
The Raw link does not contain any execution state metadata and only the output written to standard out and standard error (displayed in brown).
HTML output
Press the "HTML" link to view the HTML rendered log output. This will display the logs in the same formatted way as shown in the normal log view, but without the rest of the user interface.
Download Log Output
Click "Download" to download a text format of the log output.
Definition
Part of the execution model consists of the definition. For jobs this includes any steps and for Commands this contains the command string. Besides steps, the definition includes the nodes filter expression and the matched nodes. You can also note, that workflow strategy, error handling and concurrency settings are also visible.
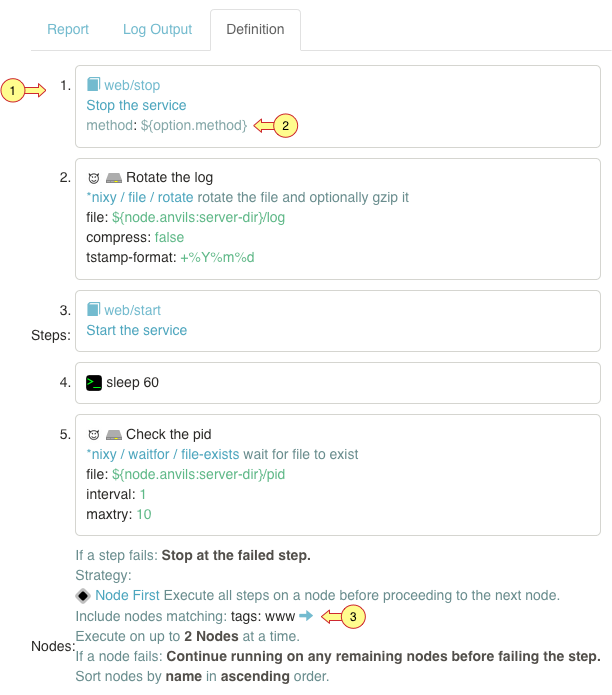
- Job steps. Each step is numbered in the order of execution. Each step type is recognizable by a different icon.
- Extra detail for script step. Script steps have extra detail available. Clicking that link will reveal the script in a window.
- Node filtering expression. Click the expression to reveal the nodes that were part of the execution.
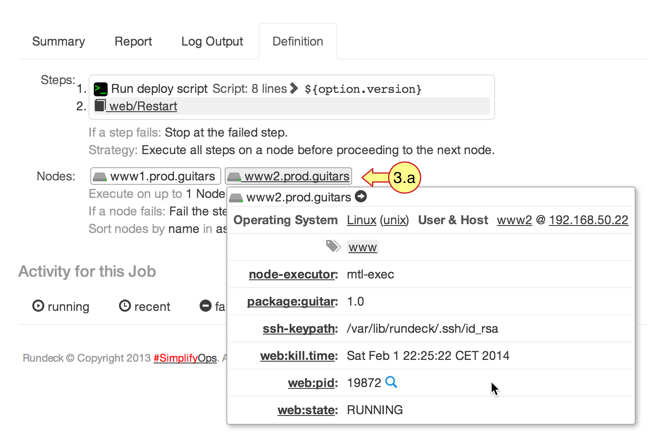
- 3.a. Clicking on any of the attributes will take you to the Nodes page and match any nodes with that attribute name or value.
Actions
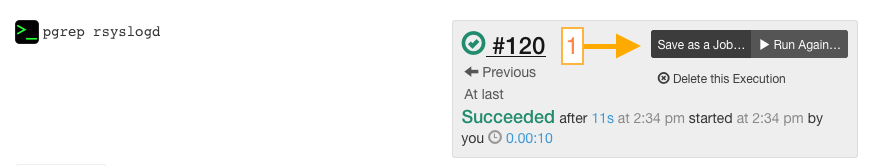
Saving a Command execution as a Job
If a command execution needs repeating you may wish to save it as a Job. Of course, this assumes you have the appropriate ACL privilege allowing job edit.
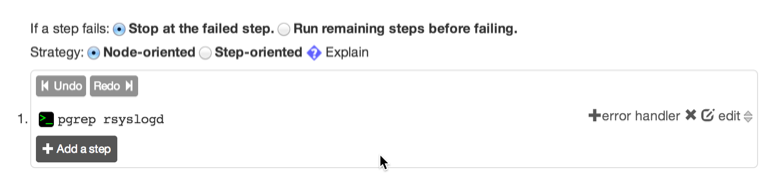
Press the "Save as a Job..." button to open the job editor and place the command string as the first step.
It will be entered in the workflow portion of the job edit form as shown below.
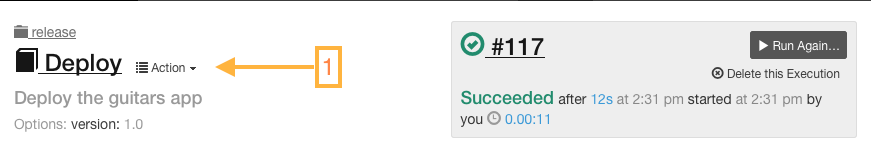
Edit the job
Press the Action menu button and choose "Edit this Job.." to open the job definition in the Job editor.
Running again
To execute the job again press the "Run Again..." button.
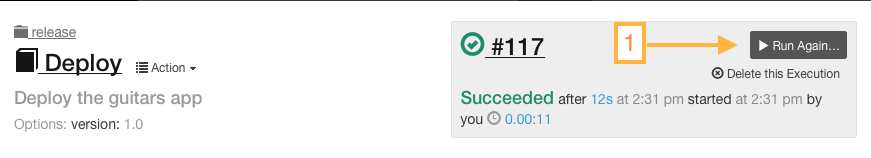
Note, the current definition is executed not the one stored in the execution.
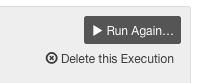
Deleting
If you have access, you can delete the execution by clicking "Delete this Execution" and confirming.
Related Command Line Tools
- rd executions
- List running executions, attach and follow their output, or kill them.