# Automated Diagnostics - Kubernetes Logs
# Solution Summary
This solution will walk through an example of enriching PagerDuty incidents by retrieving diagnostic data from a single data-source using a Rundeck Job. At the end of building this solution, when an incident is created in PagerDuty, users will be presented with a button to retrieve recent logs from Kubernetes pods and view those logs from within the PagerDuty user-interface.
The design principles outlined in this solution are applicable to most other use-cases for retrieving diagnostic-data or invoking remediation.
Solution Prerequisites
For this guide, Rundeck Enterprise or Rundeck Community must be installed and running. Instructions for both products are provided below.
A PagerDuty account with the Automation Actions add-on enabled is also required. Automation Actions is available as an add-on for Business and Digital Operations pricing plans. Please contact us (opens new window) if you would like to upgrade your plan or to trial Automation Actions.
This solution is meant to demonstrate design principles, and therefore the steps outlined in this Rundeck Job may not be applicable to your specific environment.
# Configure Rundeck Job
- In PagerDuty, generate an API Access Key with (at minimum) Responder permissions. This can either be a General Access API Key (opens new window) or a User Token API Key (opens new window).
- Copy the PagerDuty API Key into Rundeck's Key Storage as a Password or into your secrets-manager that is integrated with Rundeck.
- Download the sample Rundeck Job YAML from this link (opens new window).
(Right click and select Save Link As... and be sure to append
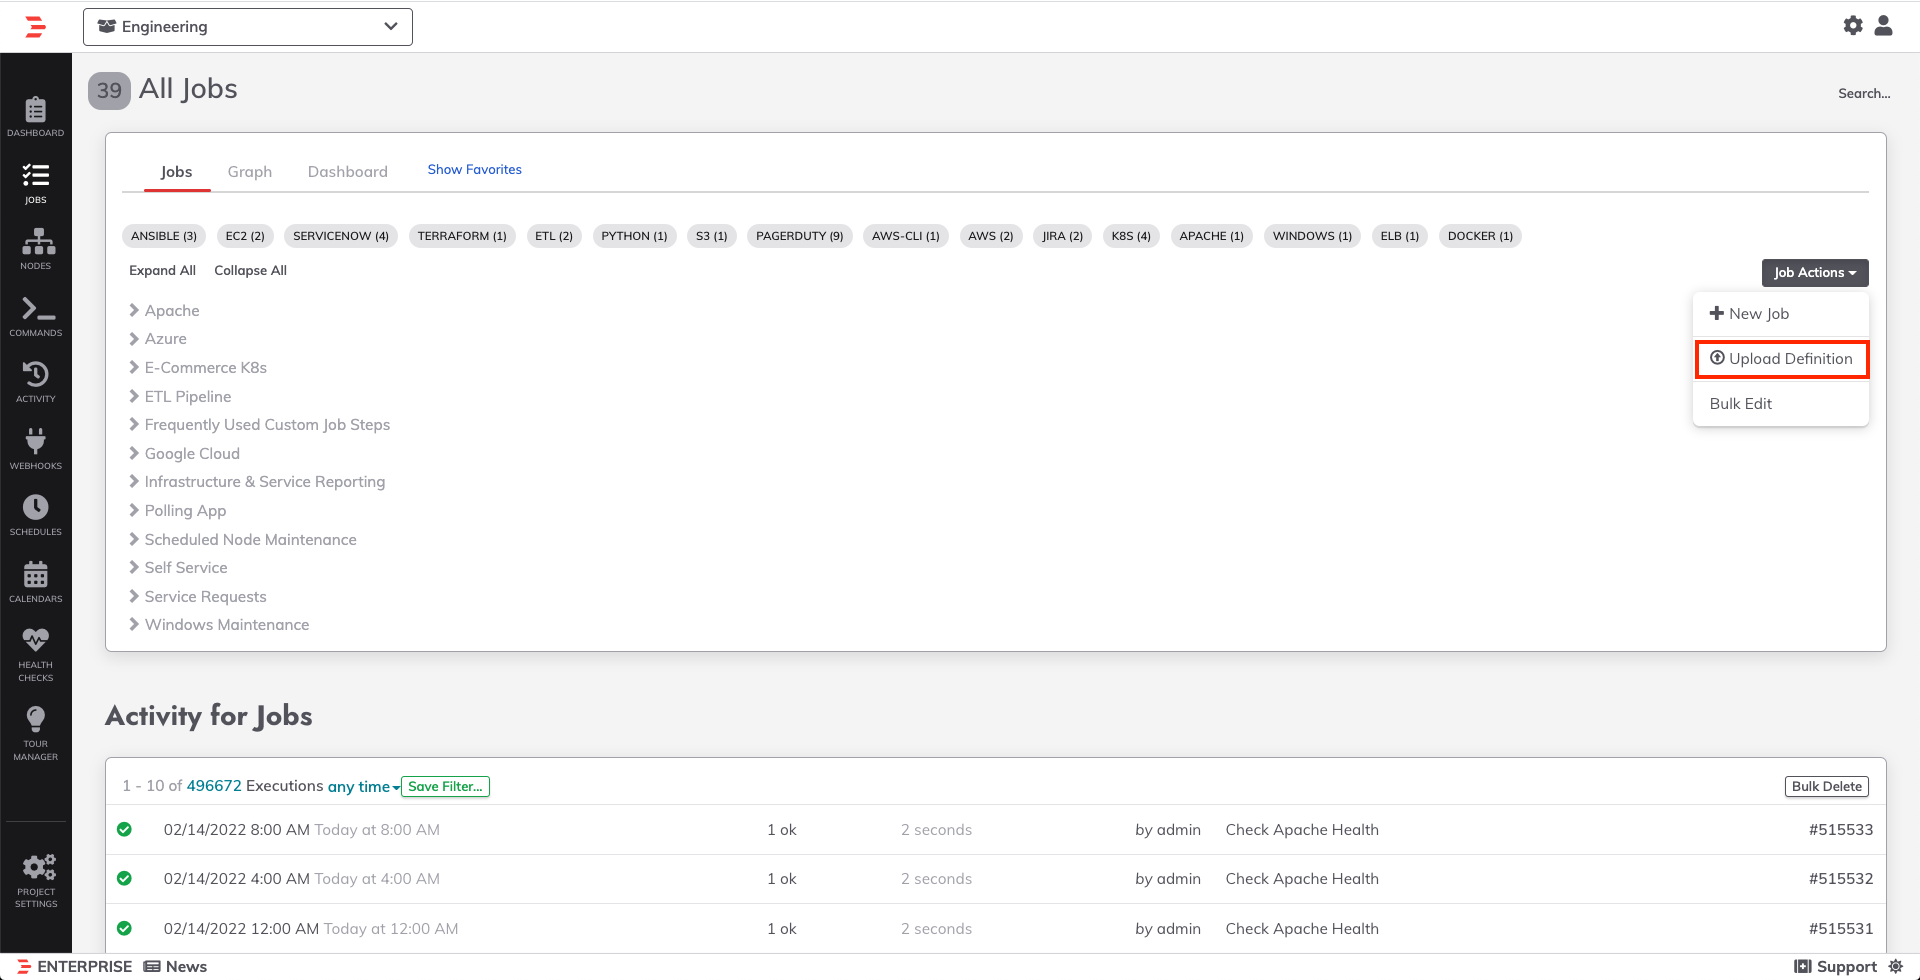
.yamlto the file name). Note that this Job definition will only work with Rundeck Enterprise. Click the Rundeck Community tab if you are using Rundeck Community. - Upload the sample job to your Rundeck Enterprise instance by navigating to the Jobs tab, selecting Job Actions in the upper-right, then selecting Upload Definition.
You can find more detailed instructions for uploading a Job Definition here.
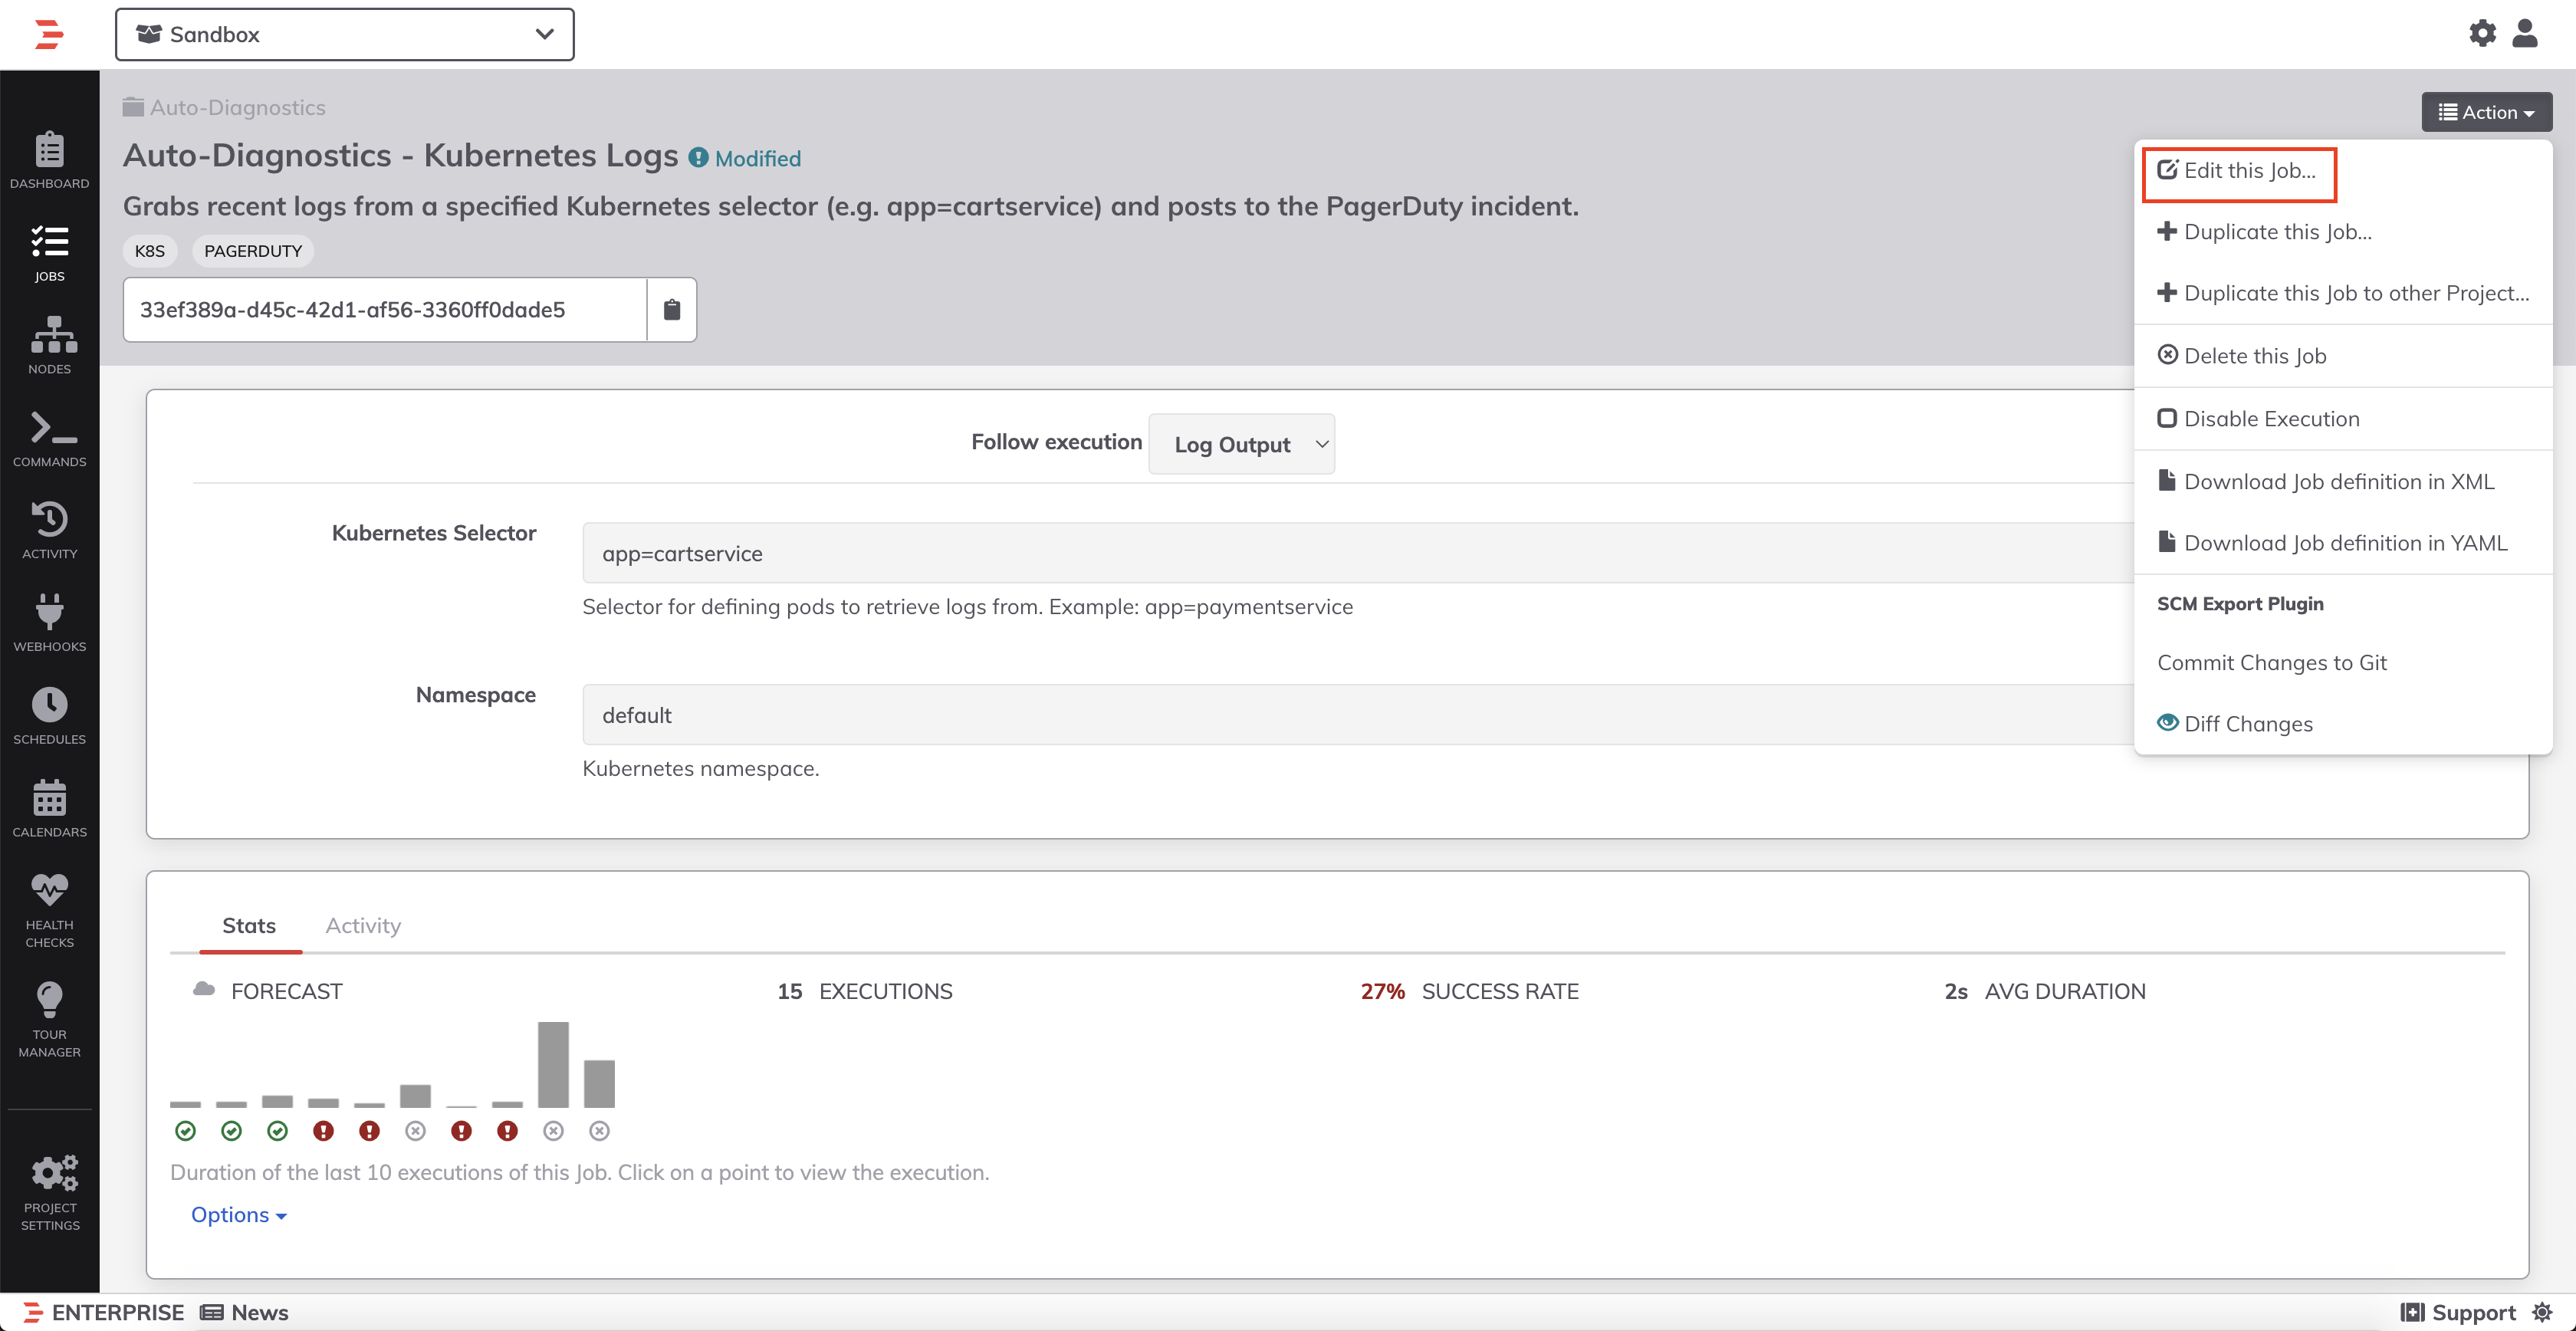
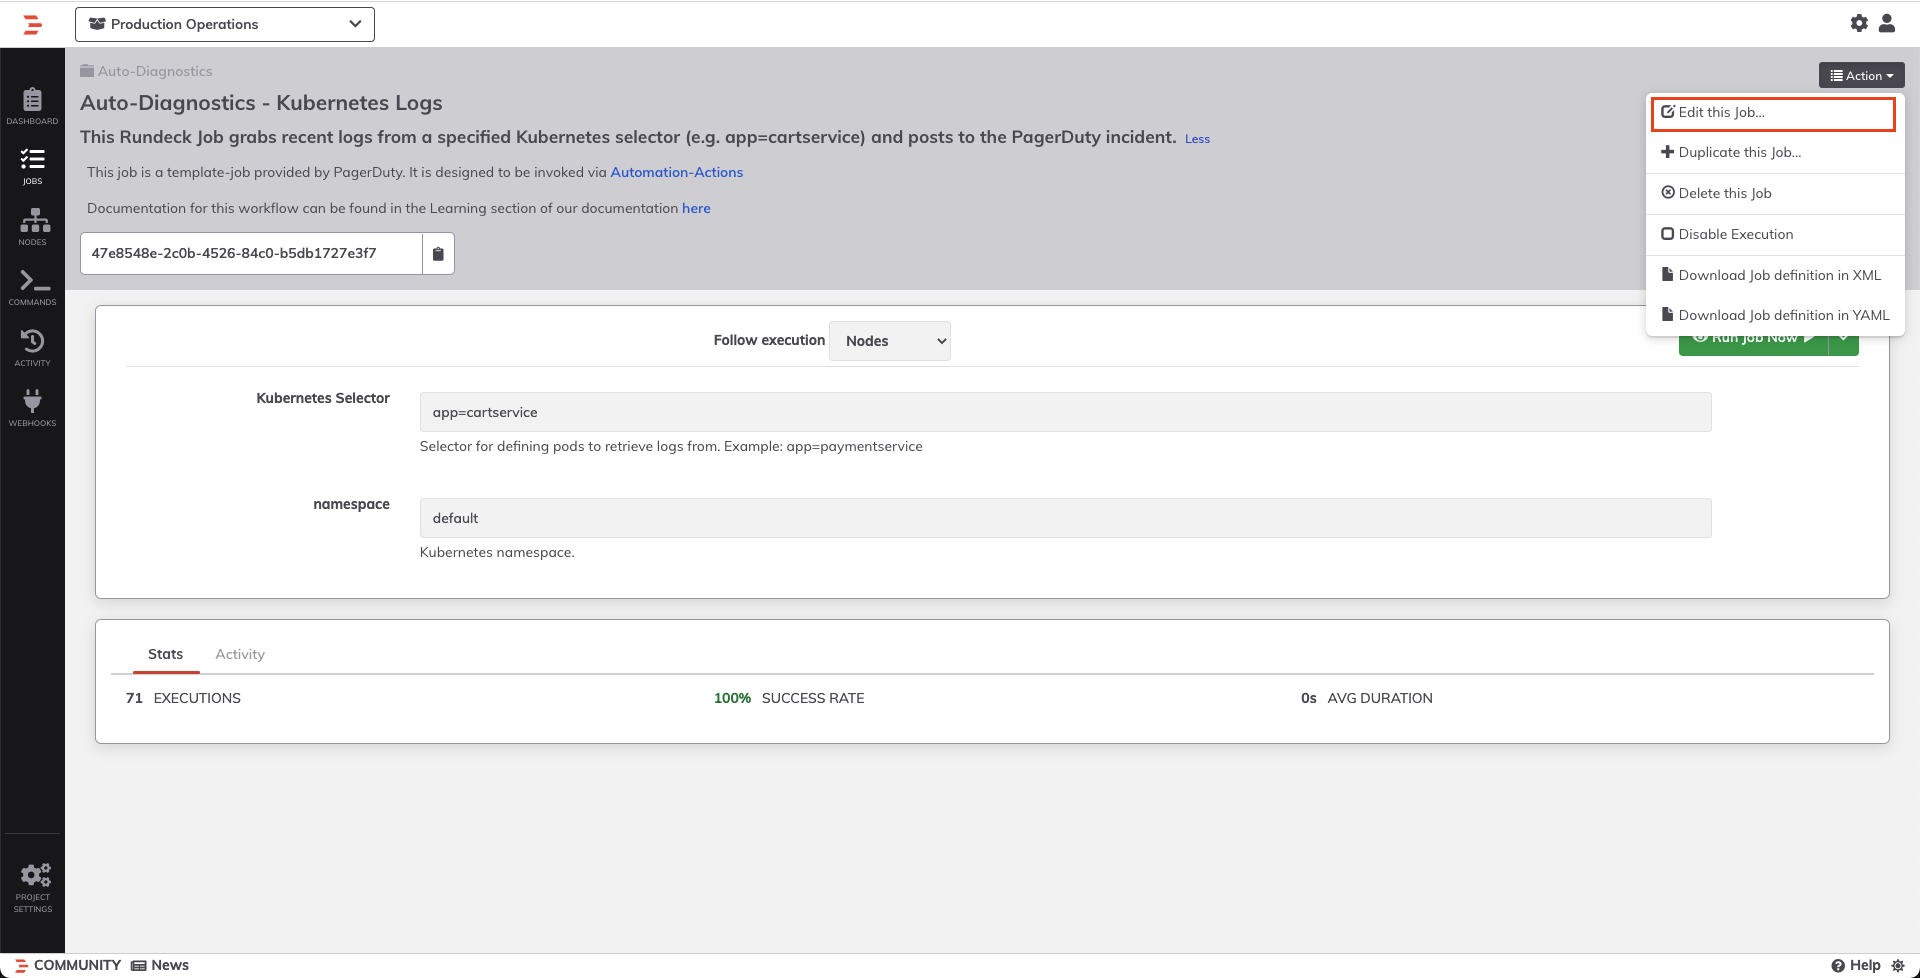
- Edit the Job by clicking Edit This Job:
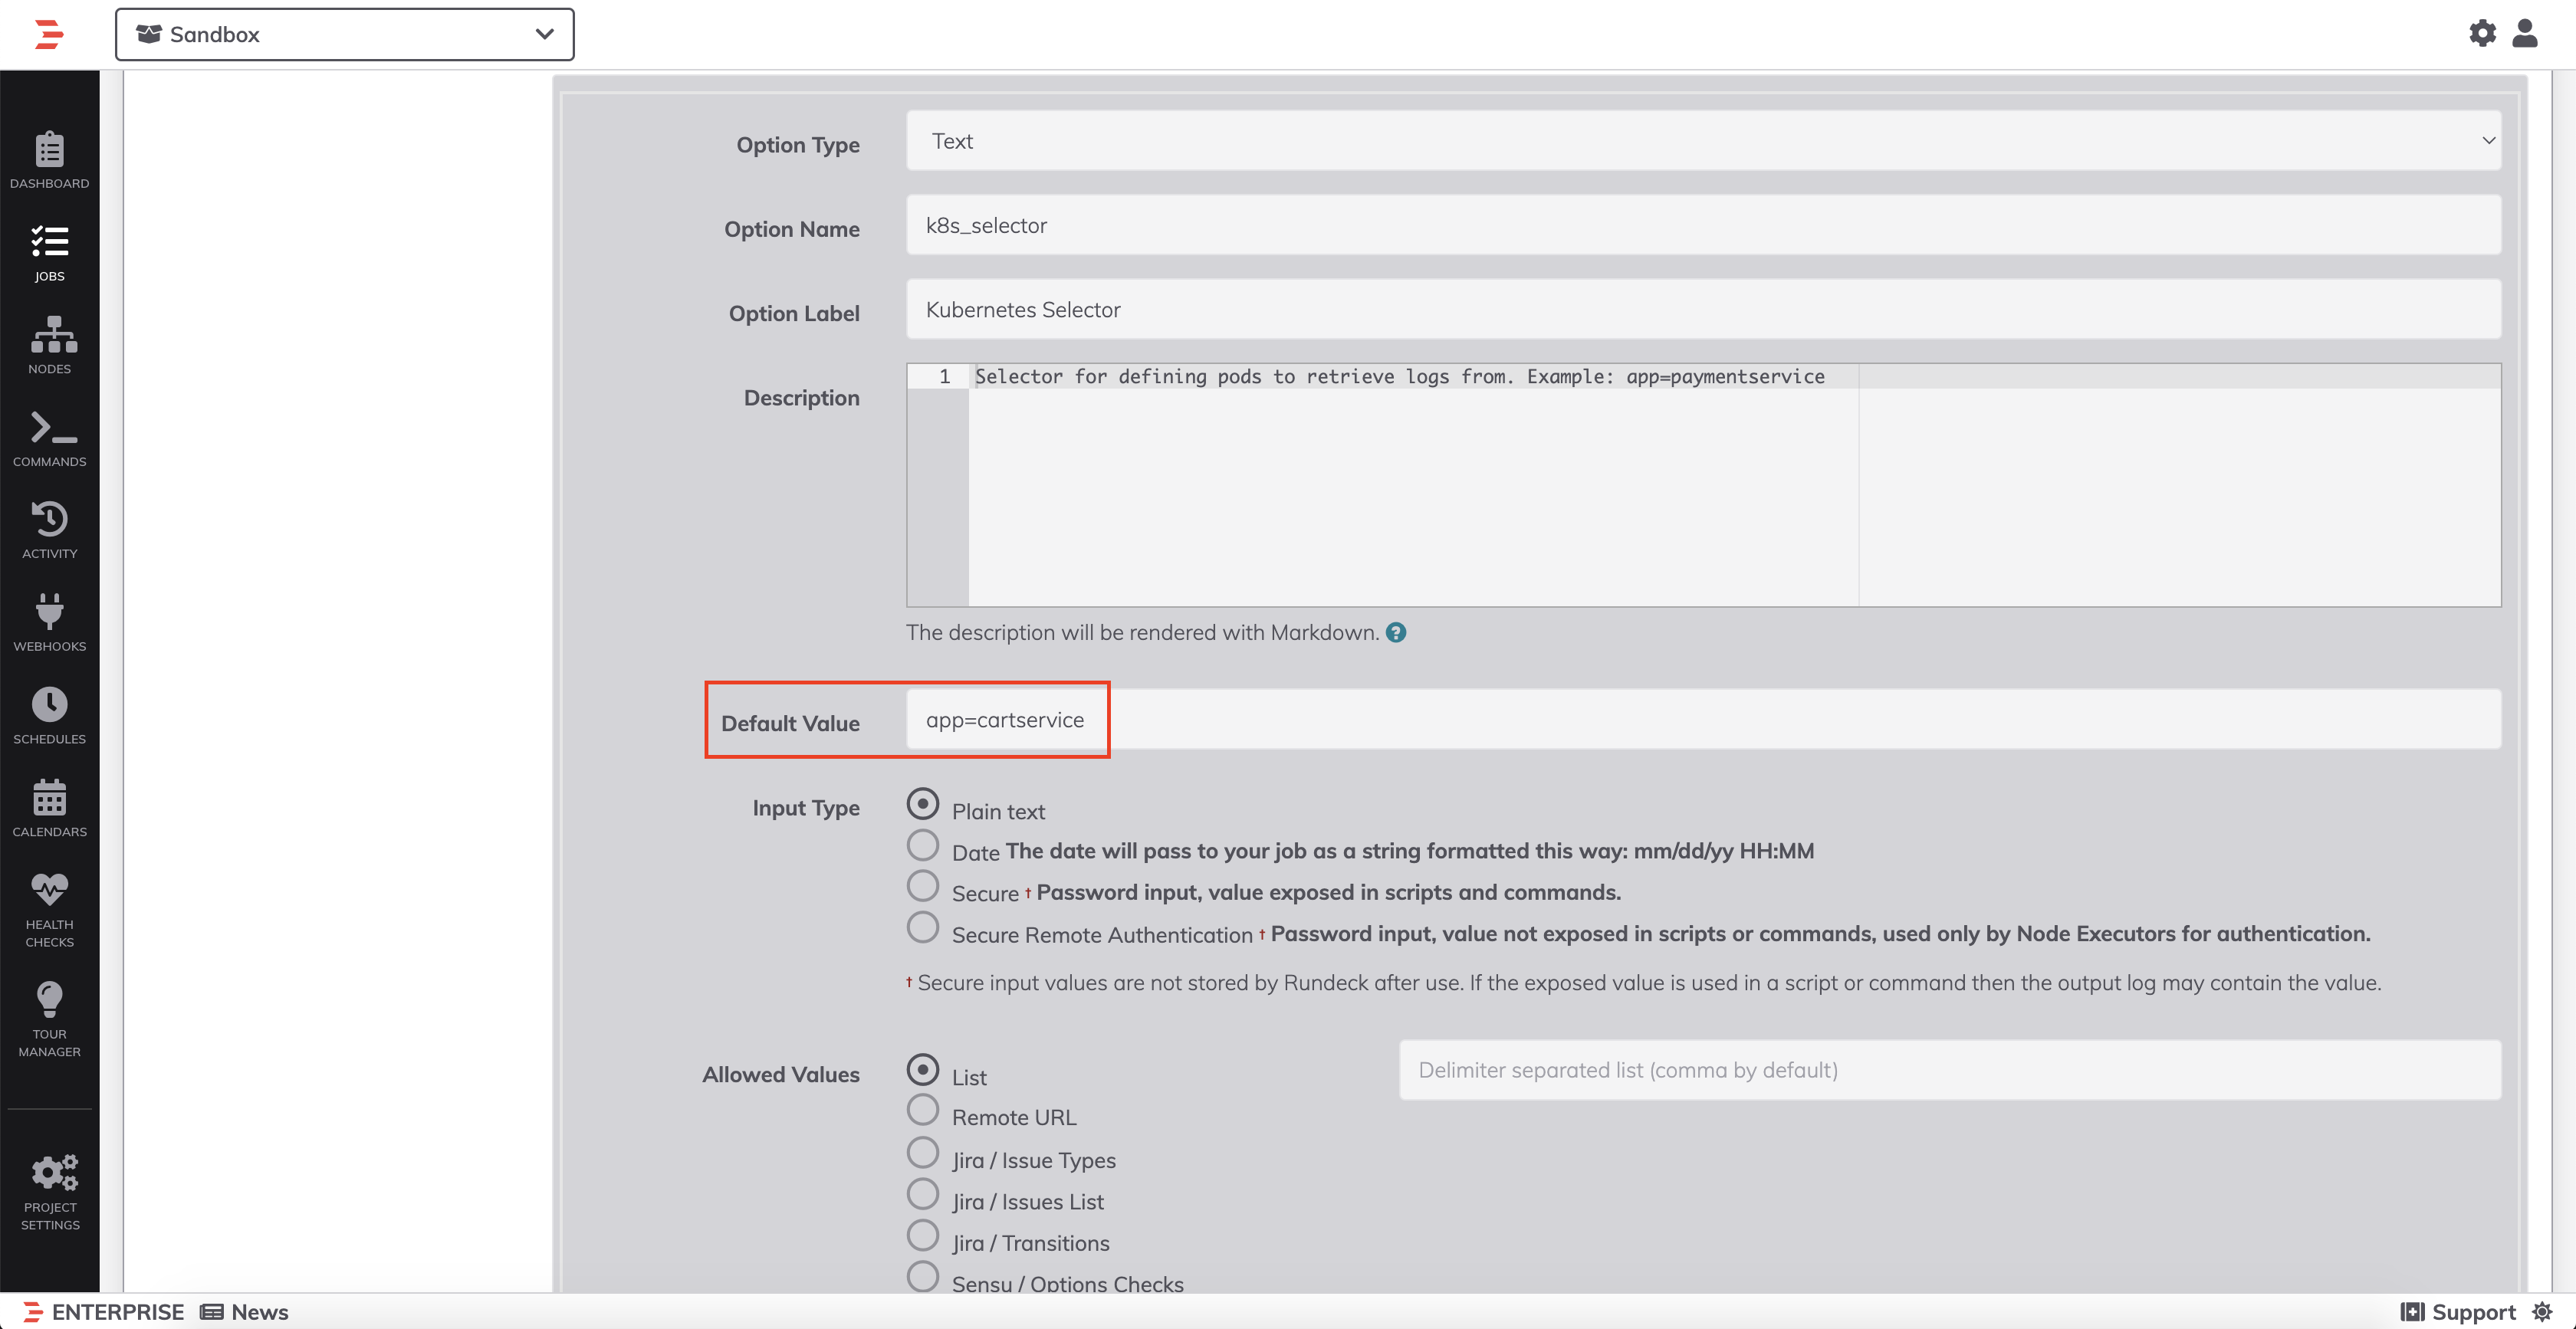
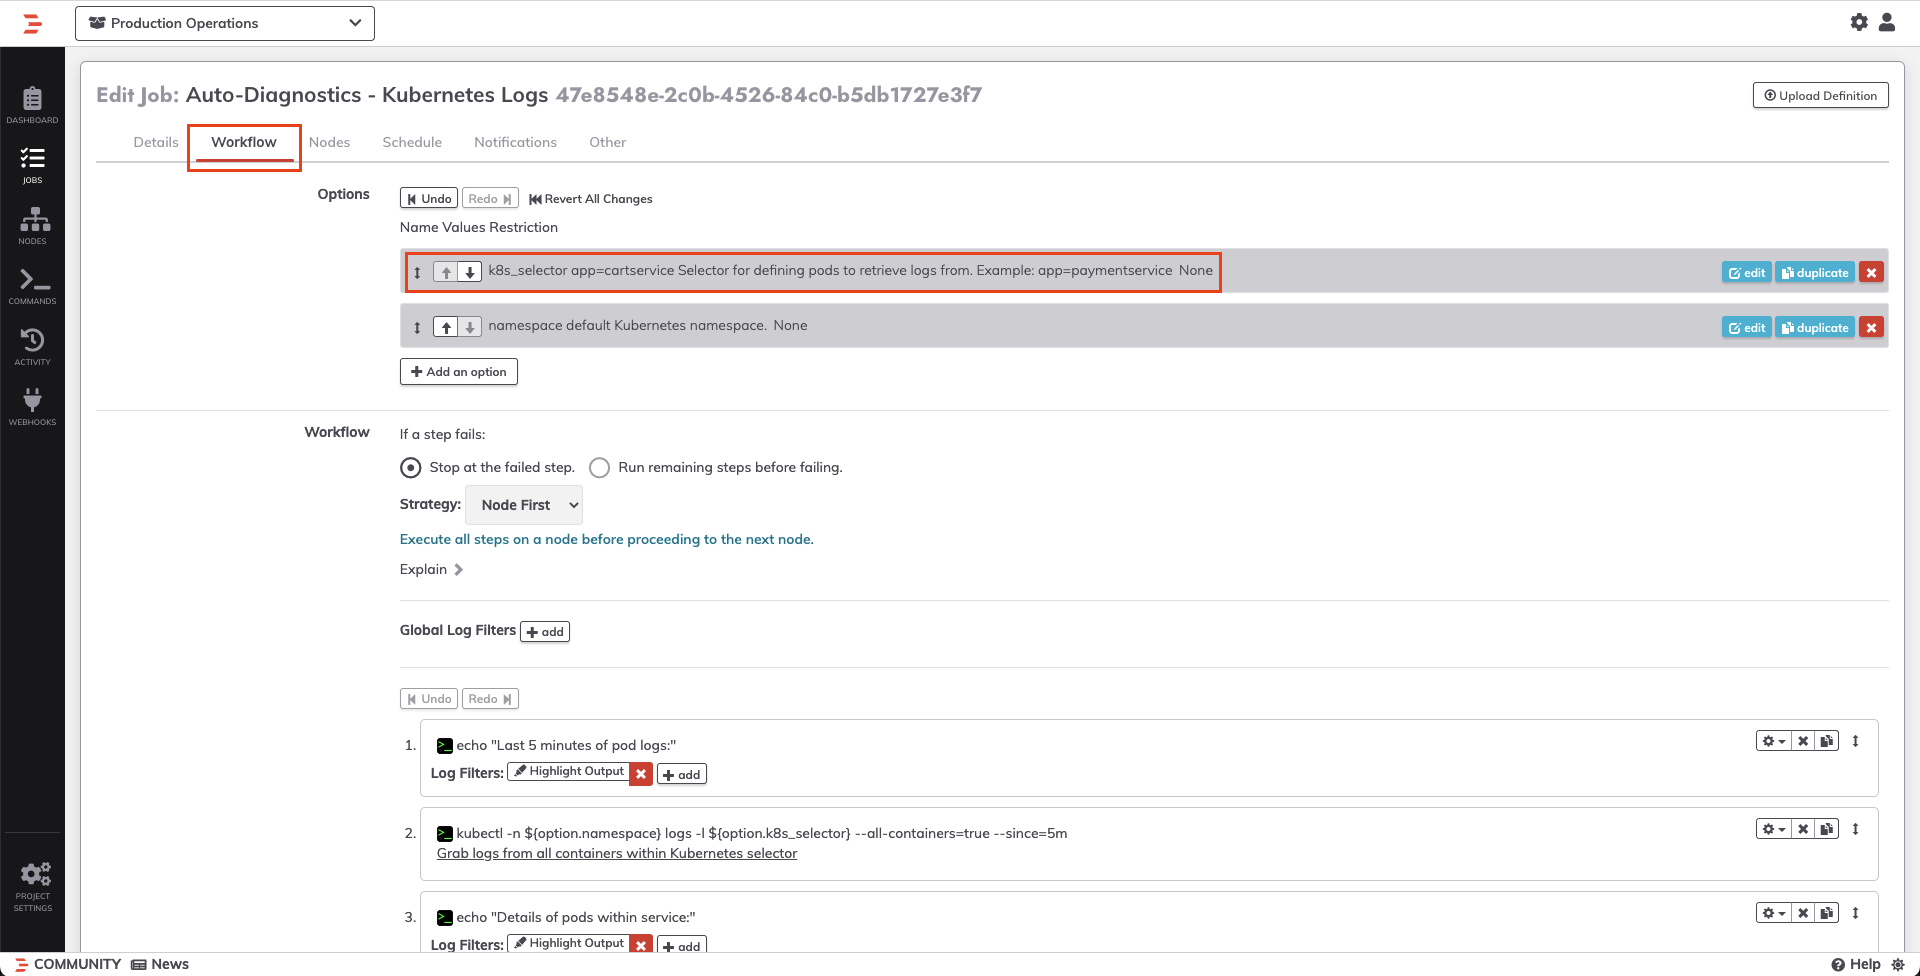
- Click into the Workflow tab and then in the Options section, select the
k8s_selectoroption, and modify the selector to determine which pods to pull logs from: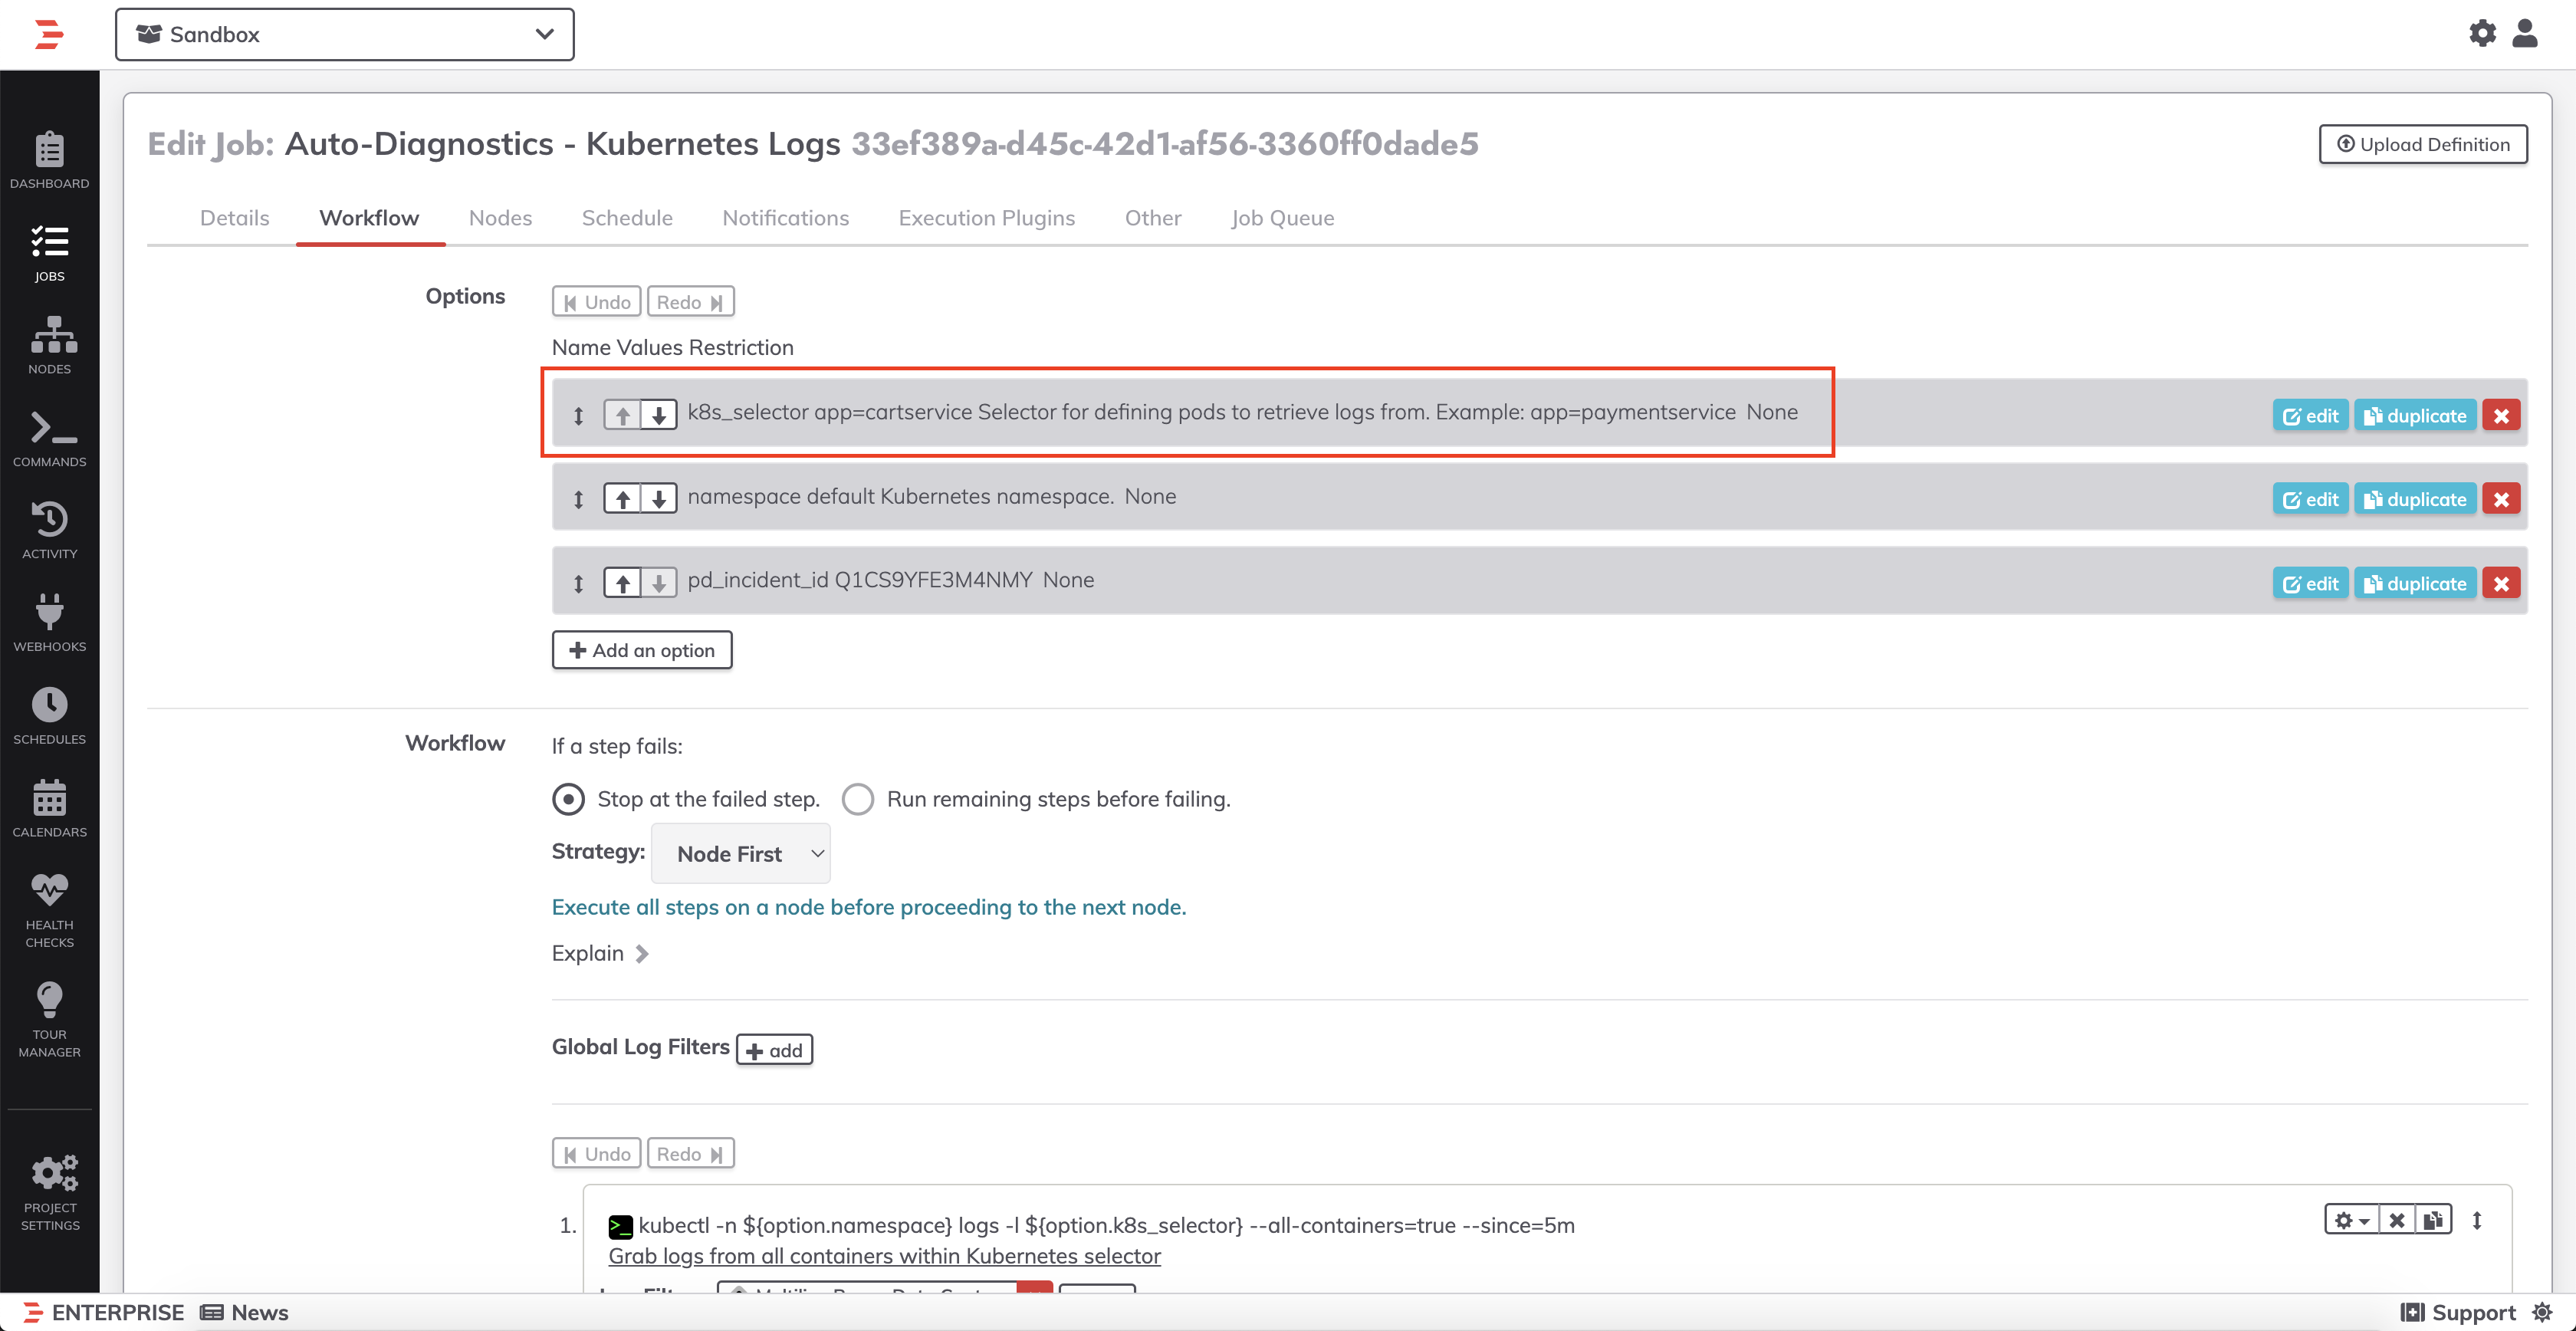
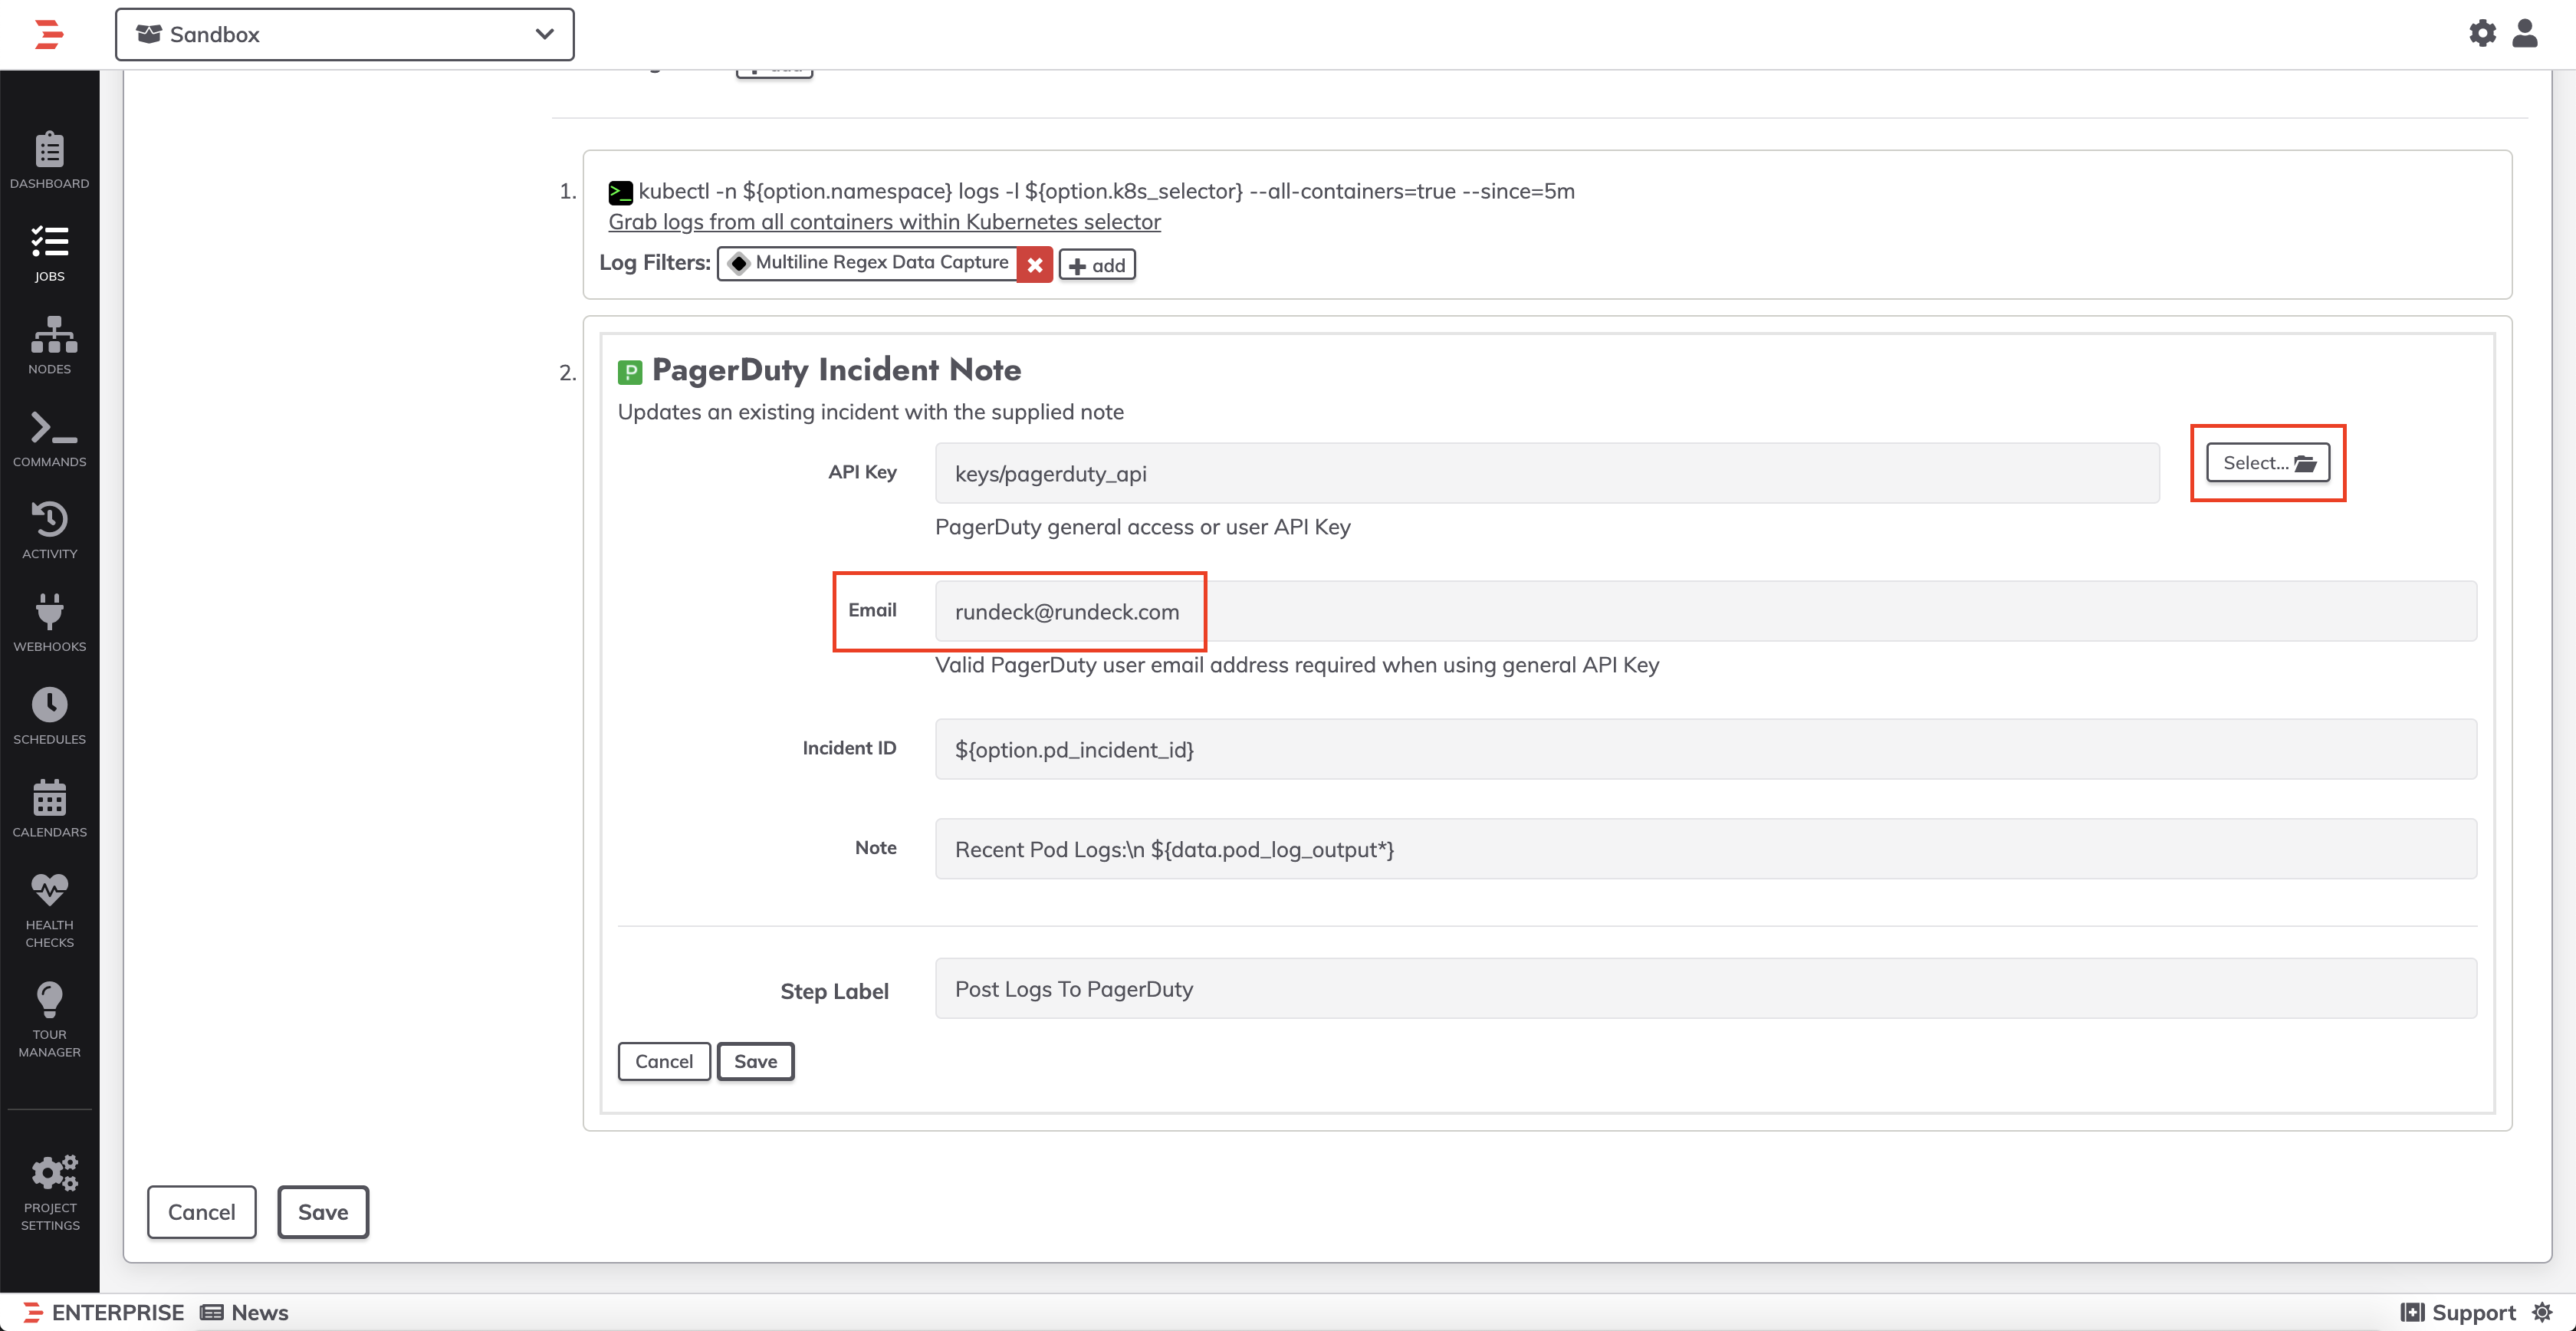
- Click into Step 2 ("Post Logs to PagerDuty"). Click the Select button next to API Key to select your API Key from Key Storage. If you used a User Token API Key for PagerDuty, then be sure to modify the email-address as well:
- Click Save on the step as well as Save on the Job.
Note
This Rundeck Job is meant to be invoked from PagerDuty, not through the Rundeck GUI. There is a hidden Job Option for the PagerDuty Incident ID. If you run the Job directly from the Rundeck Interface, the Job will fail on Step 2, as it is expecting to have the PagerDuty incident ID as an input parameter.
# Configure PagerDuty Automation Actions
PagerDuty Automation Actions Architecture
The PagerDuty Automation Actions Runner is installed in your environment and requires outbound-only access to the PagerDuty SaaS platform as well as bi-directional communication with your Rundeck instance. You do not need to allow for any inbound protocols from PagerDuty to your infrastructure.
- Create a Rundeck User API Token by navigating to User Icon -> Profile and click the + next to User API Tokens:
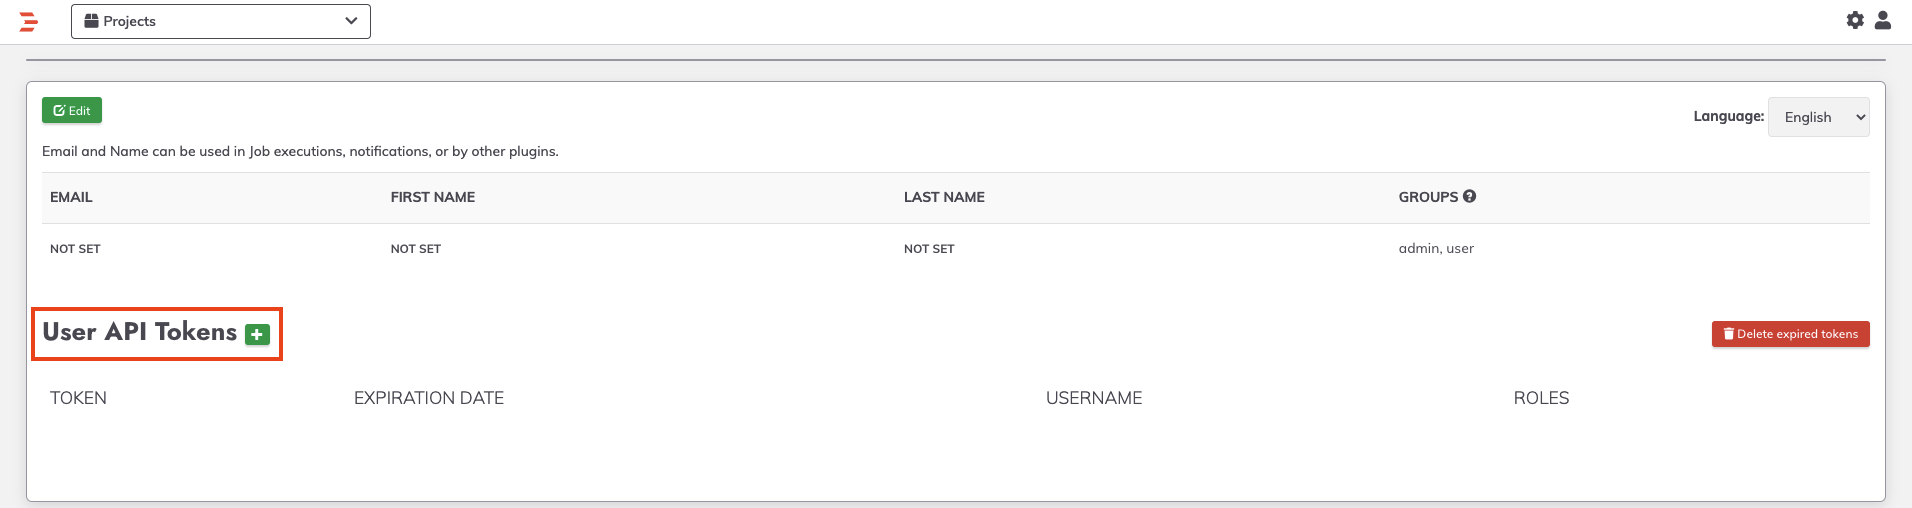
- Enter a Name for the API Token and choose a Role that has the correct levels of permissions to invoke the uploaded Job.
- Follow the instructions outlined here (opens new window) to install and configure the PagerDuty Actions Runner. Optionally use the PagerDuty API Token generated earlier for the Rundeck Job, or generate a new API Token - this token needs Read Only permissions.
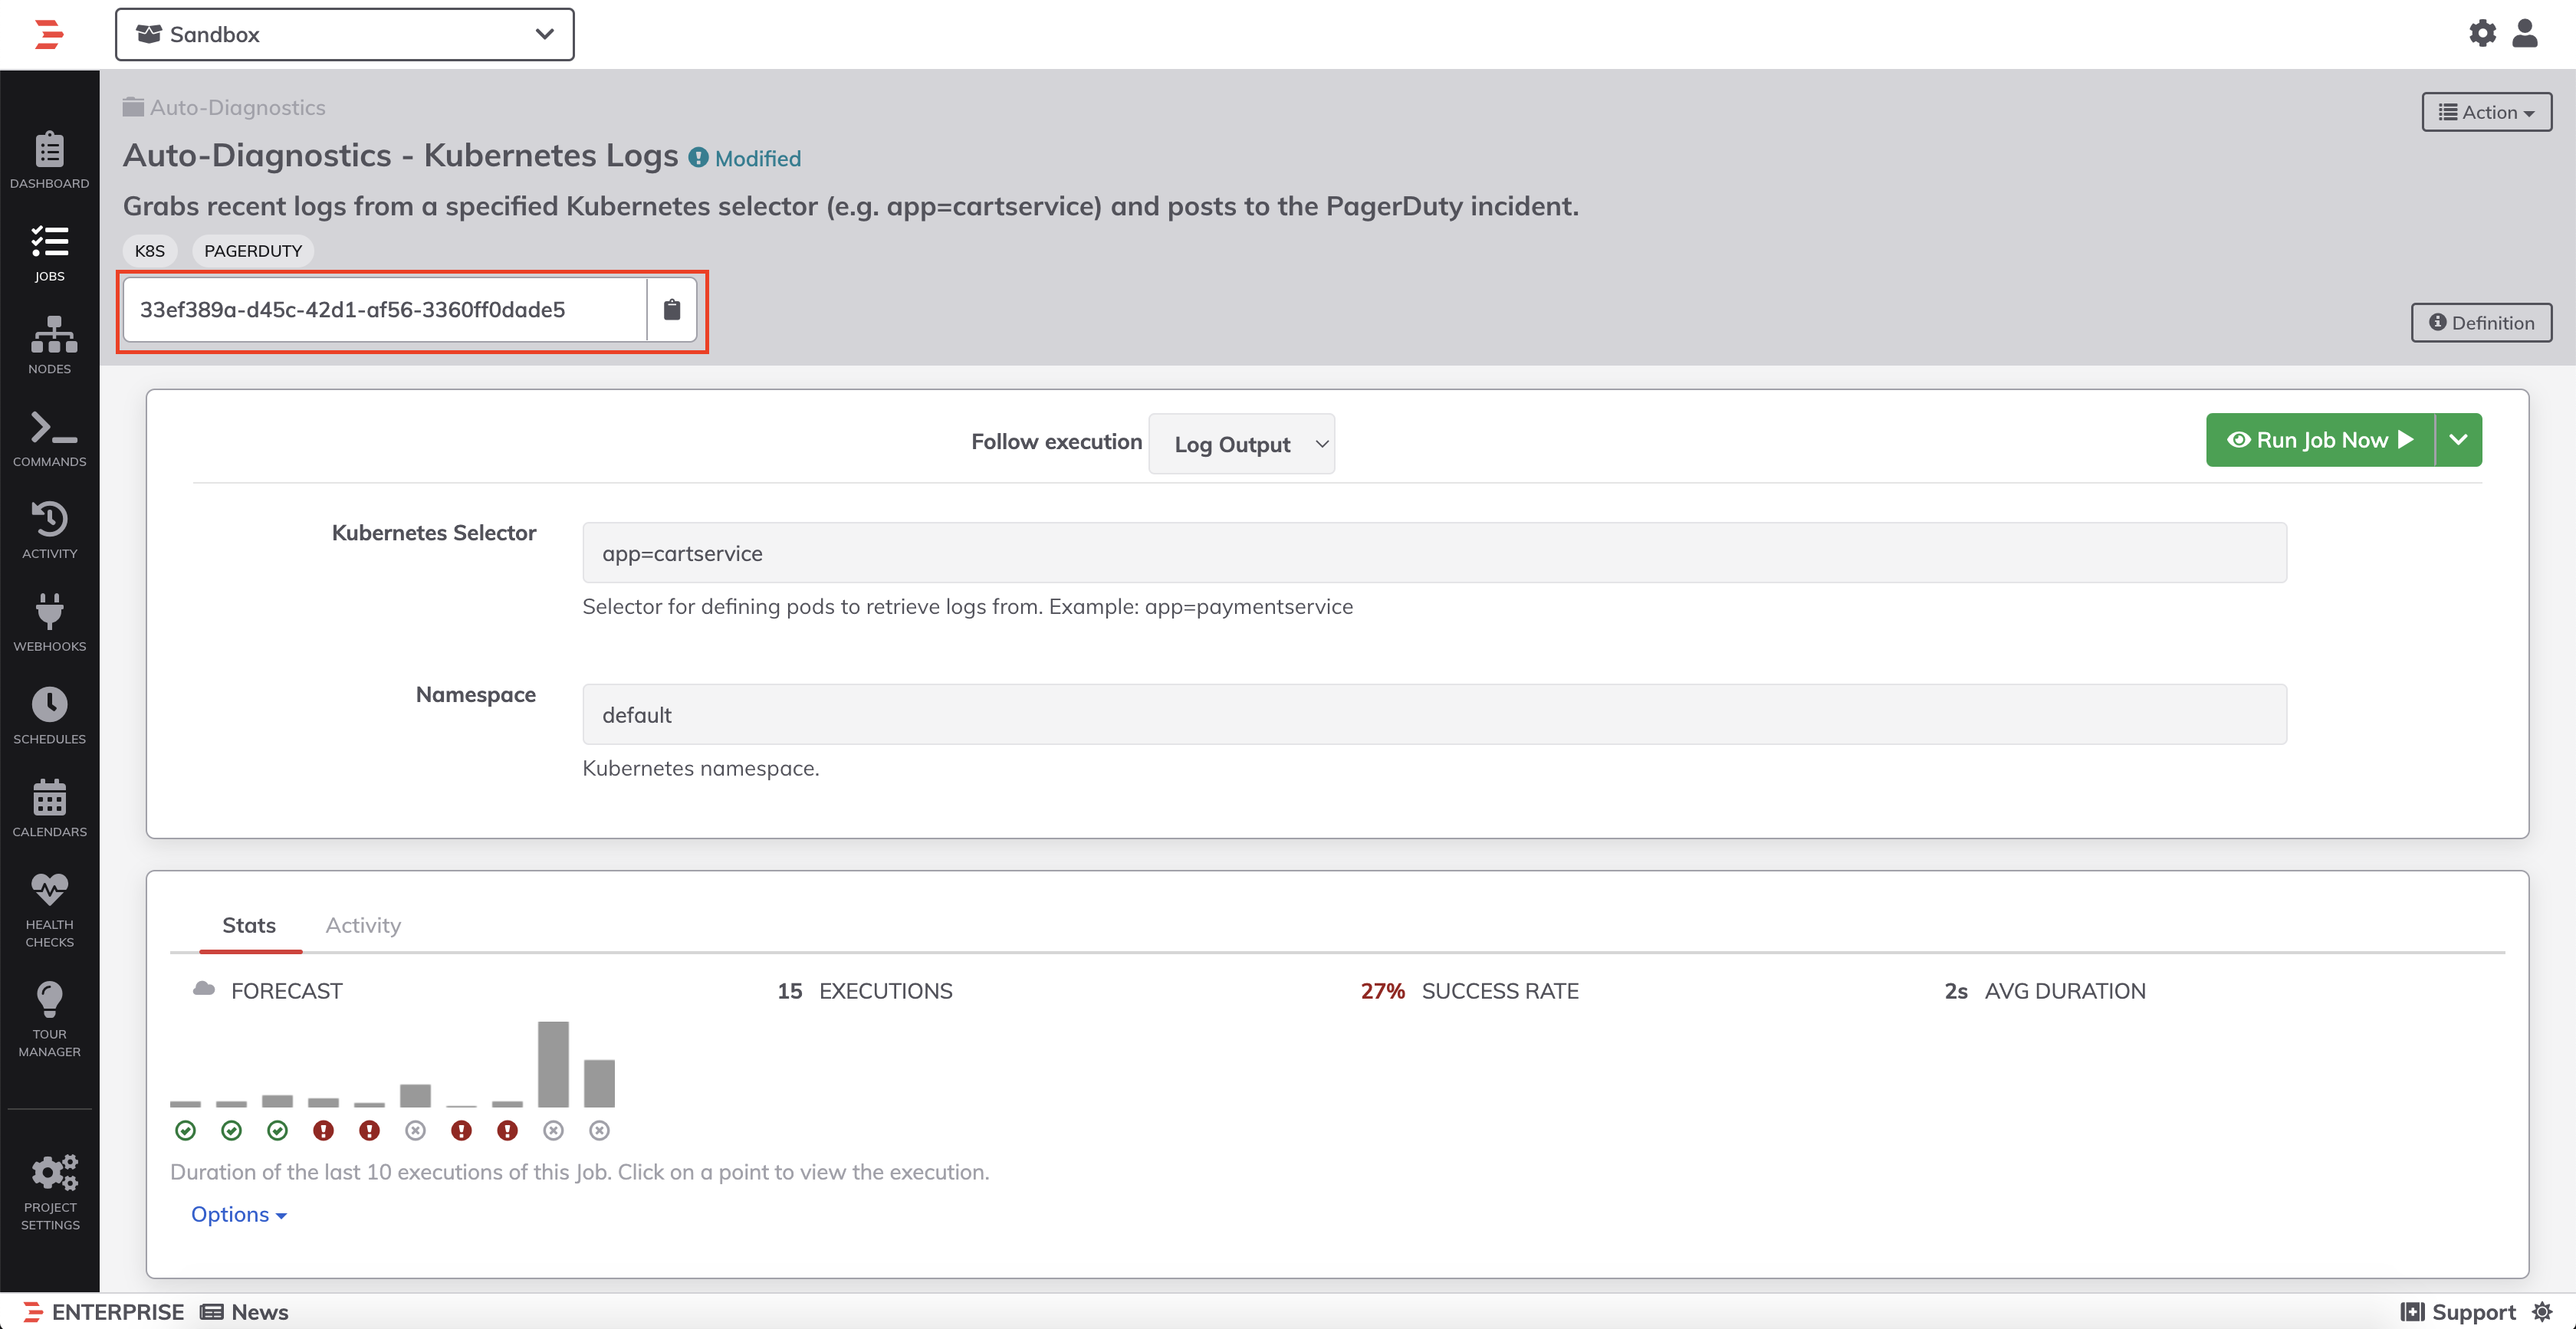
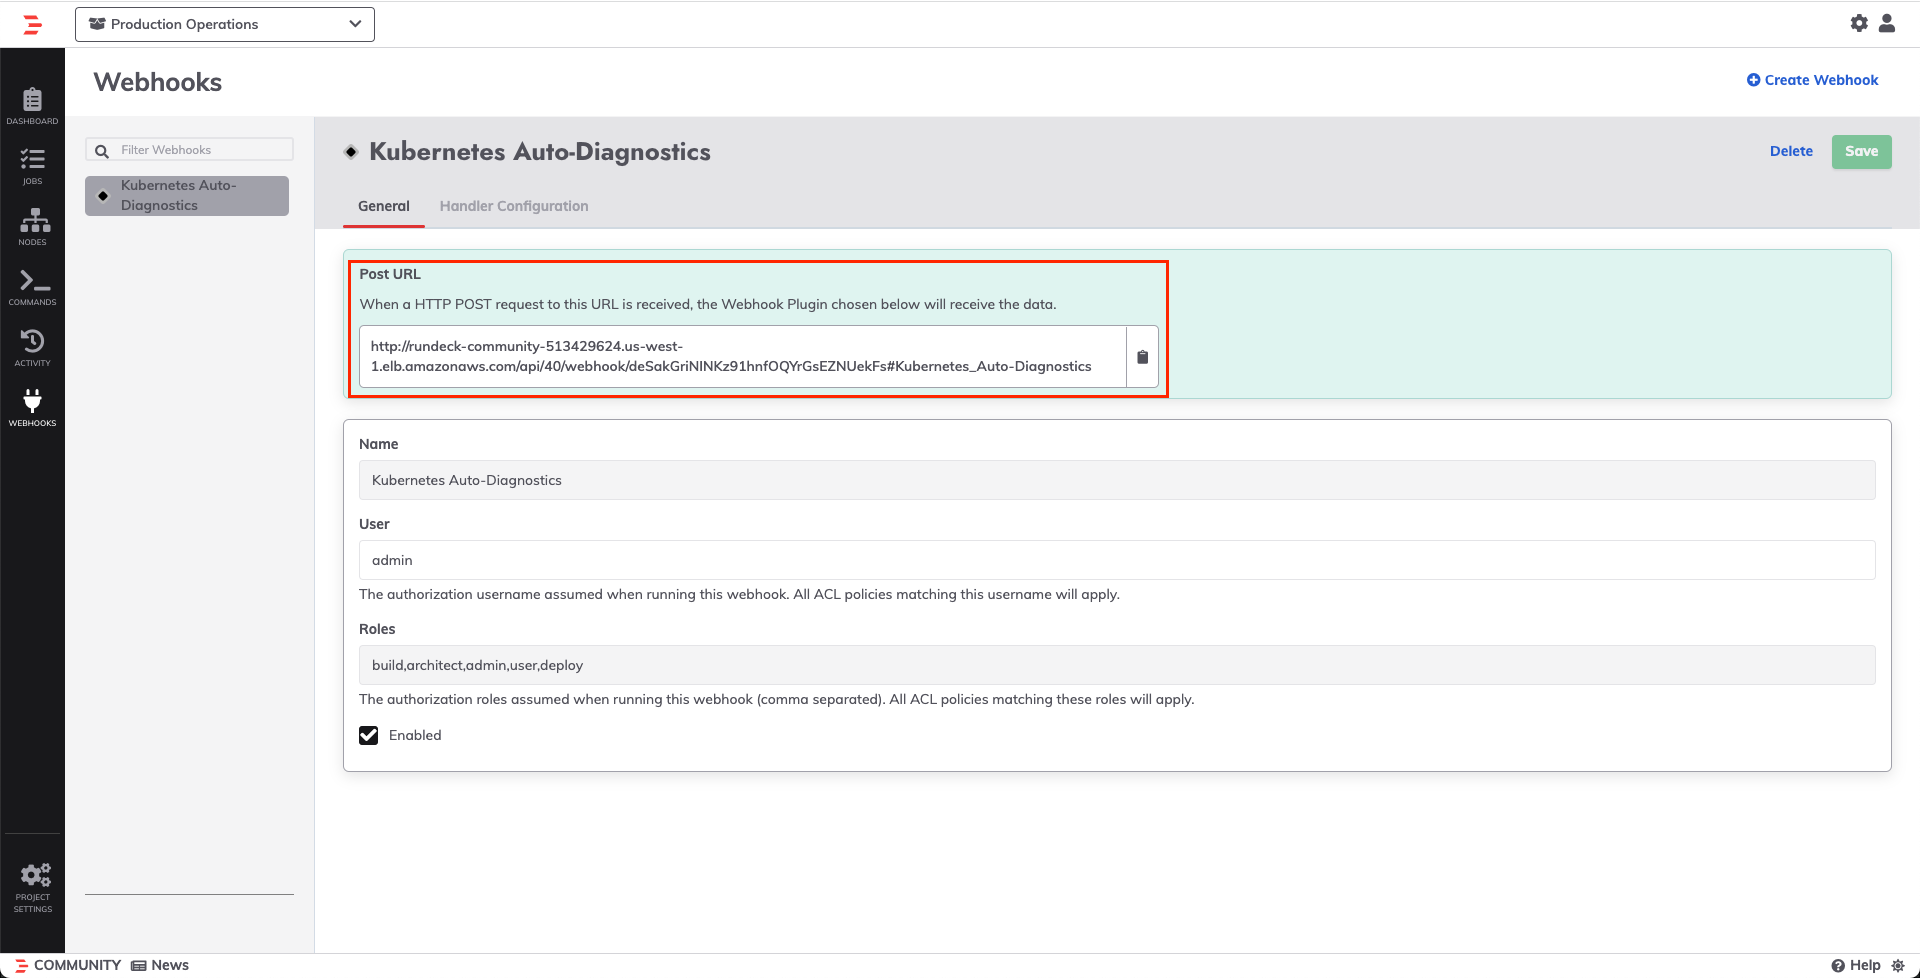
- Use the API Token generated in Step 1 and the Rundeck URL to fill in the
rundeck_tokenandrundeck_urlfields in thepdrunner-credsconfiguration file. - In Rundeck, copy the Job ID from the job invocation page:
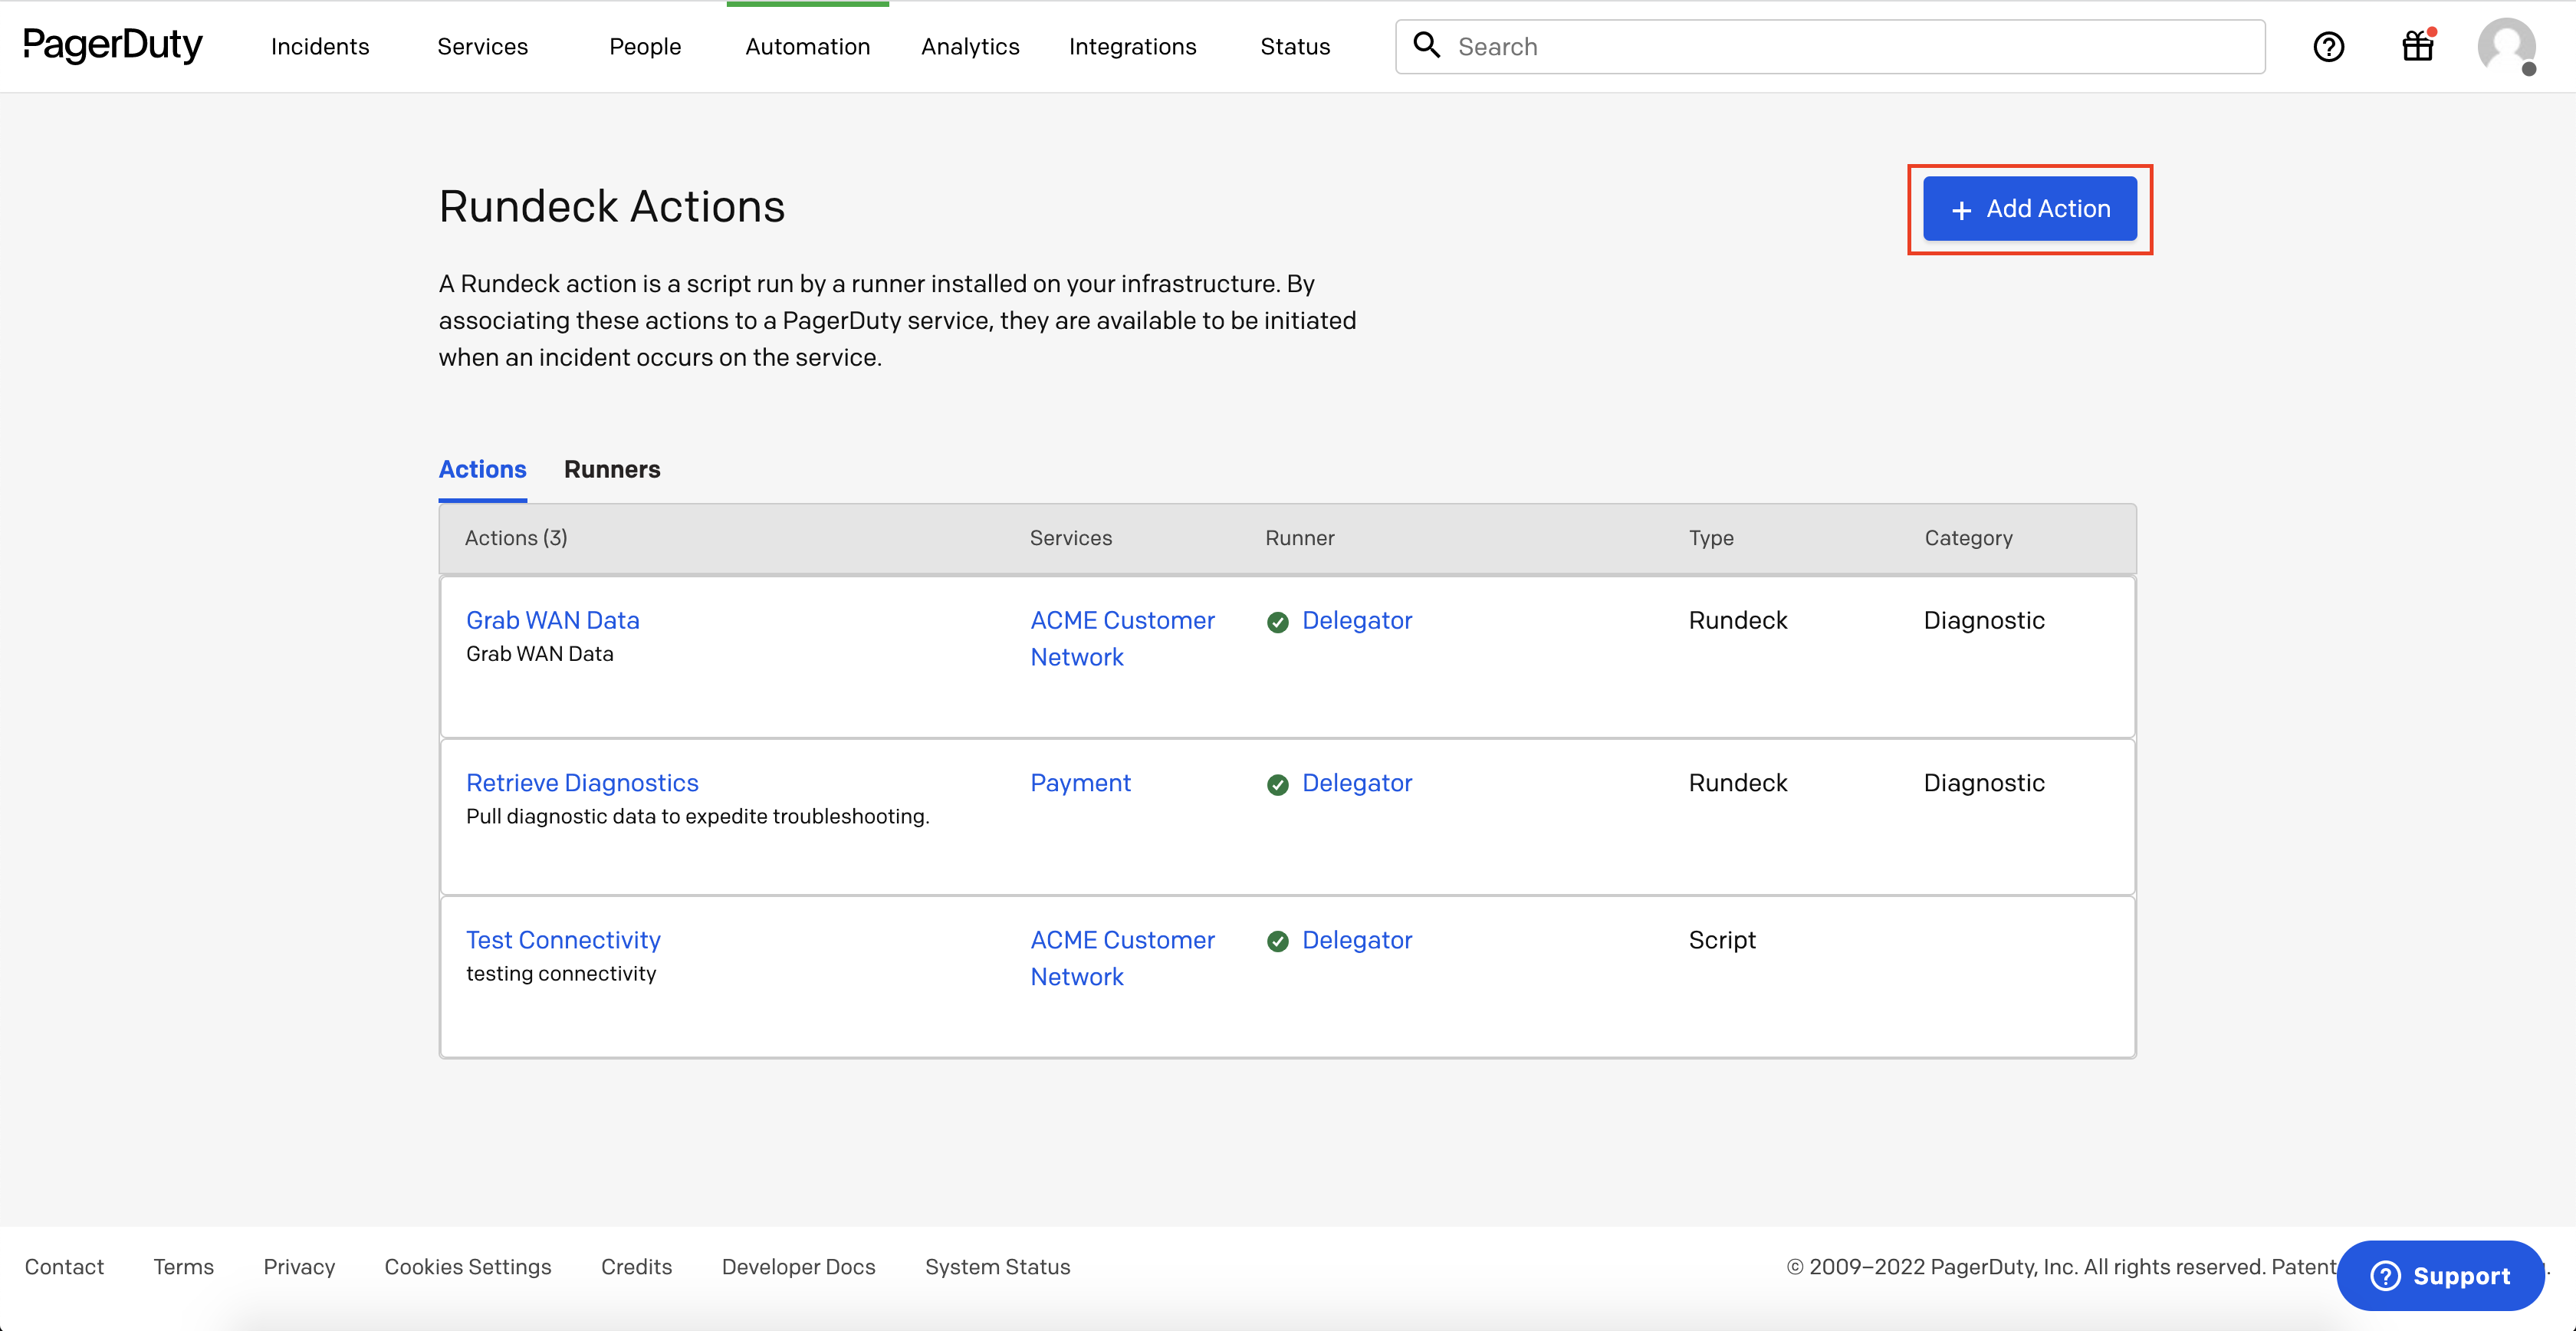
- In PagerDuty, navigate to Automation -> Rundeck Actions -> Add Action:
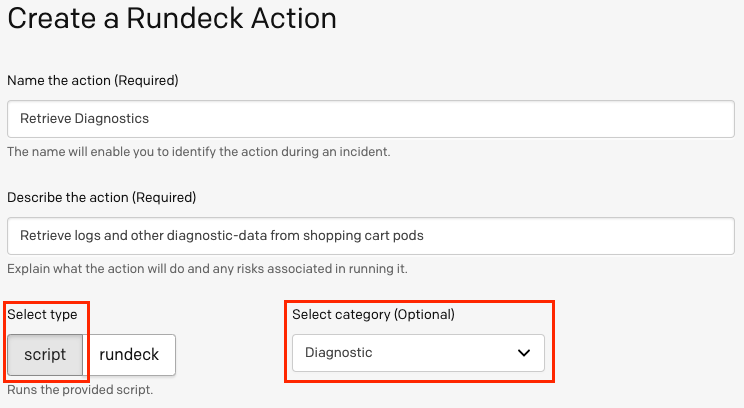
- Fill in the Automation Action details with the desired Name and Description. Select rundeck as the type of action and Diagnostic as the category.
Paste the jod ID into the Job ID field and insert-pd_incident_id ${pagerduty.incidentId}into the Rundeck arguments field: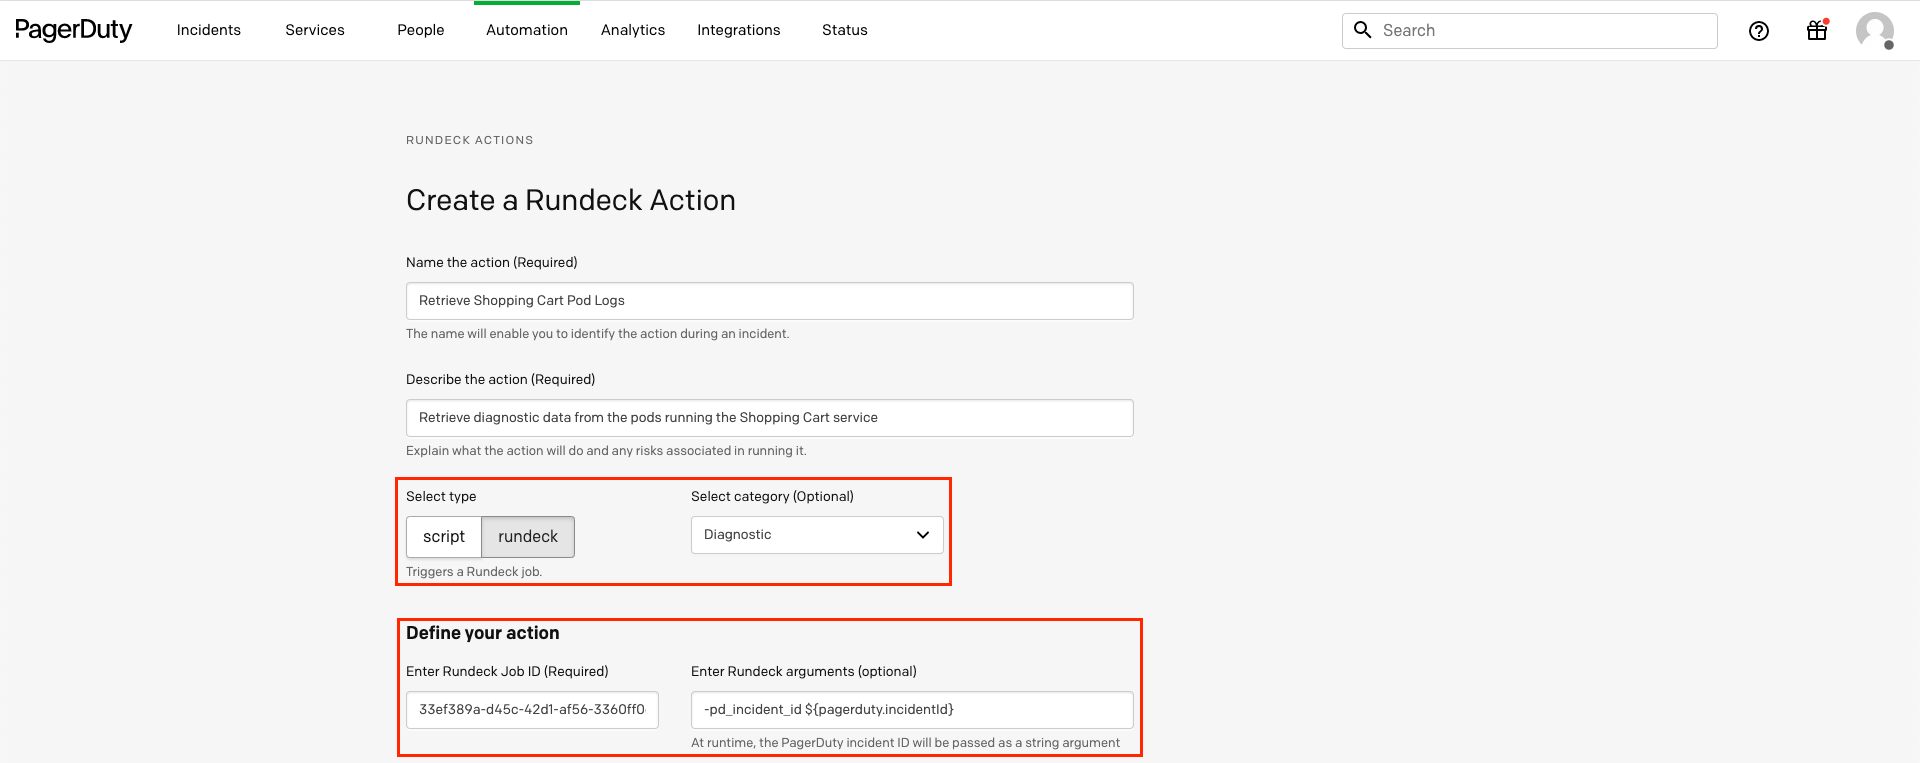
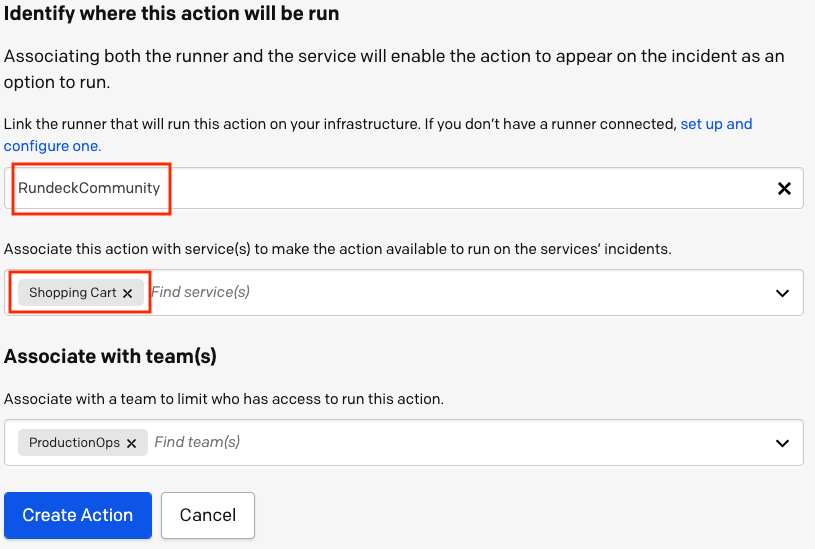
- Select the Runner that you installed from Step 3 and then select the same Kubernetes service associated with the Kubernetes Selector from Step 6 of configuring the Rundeck Job.
# Run the Auto-Diagnostics Action from PagerDuty Incidents
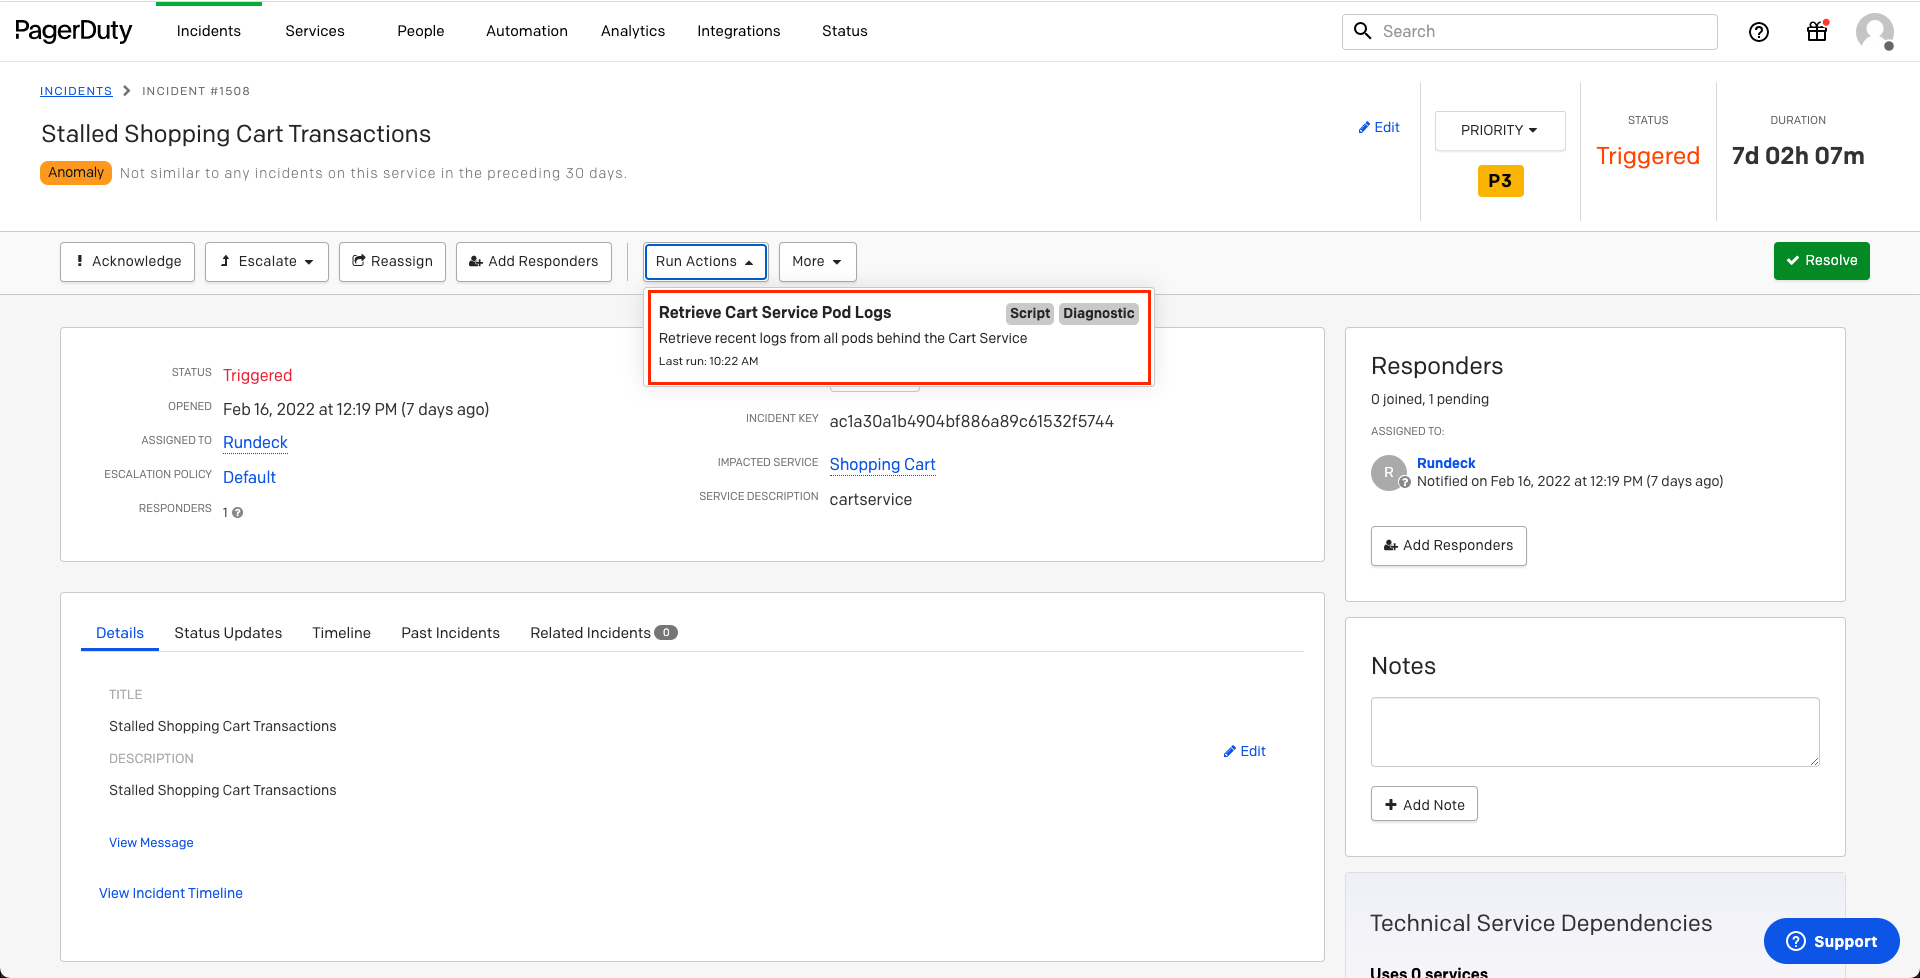
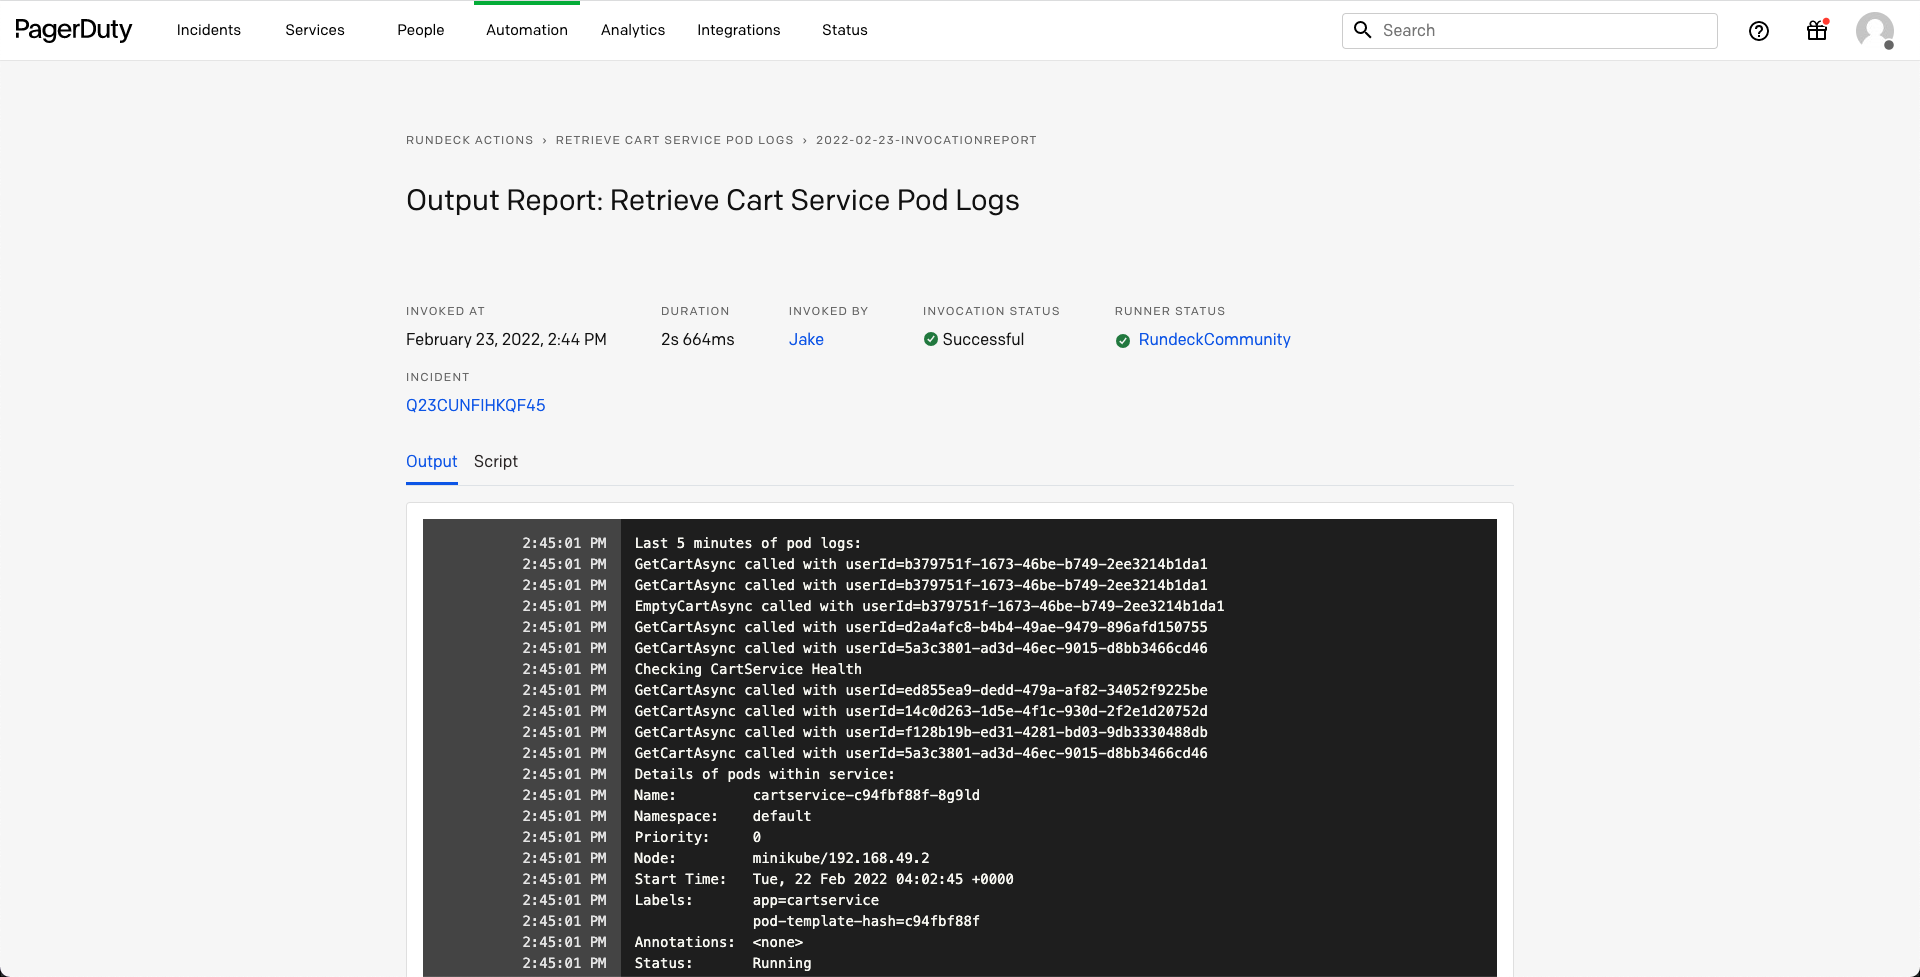
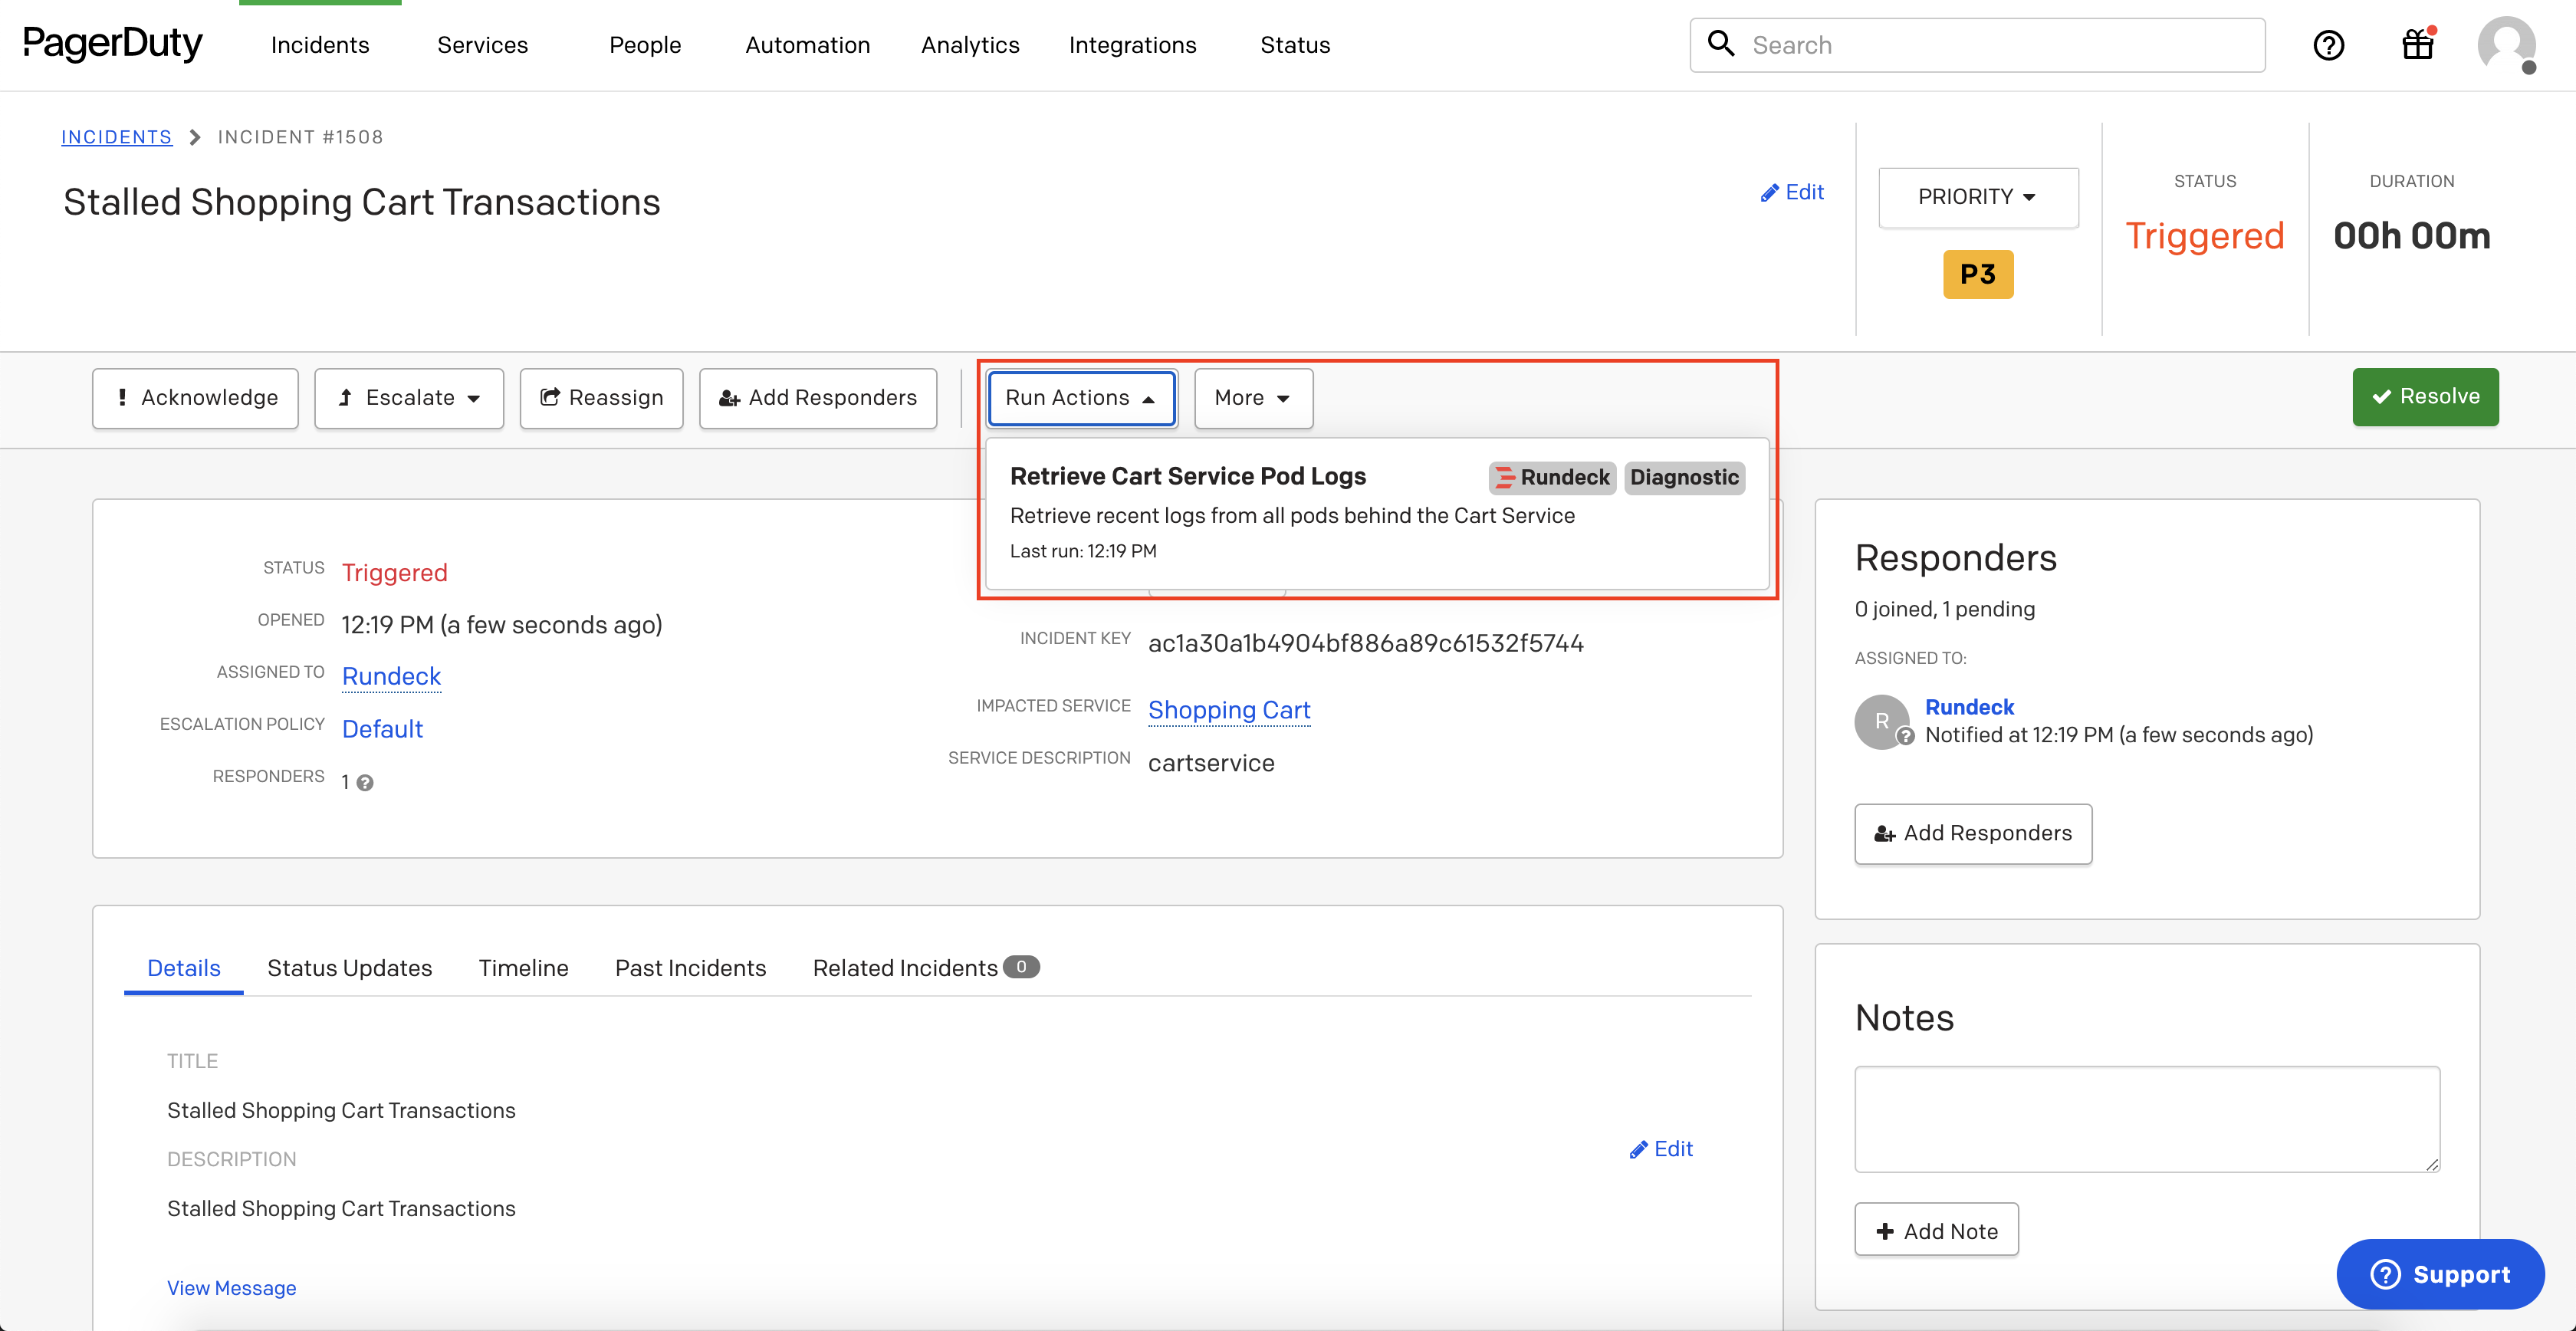
When incidents are created on the Service associated with the Rundeck Action, there will now be an option in the Run Actions dropdown that will trigger the automation configured in the prior sections to retrieve Kubernetes Logs:
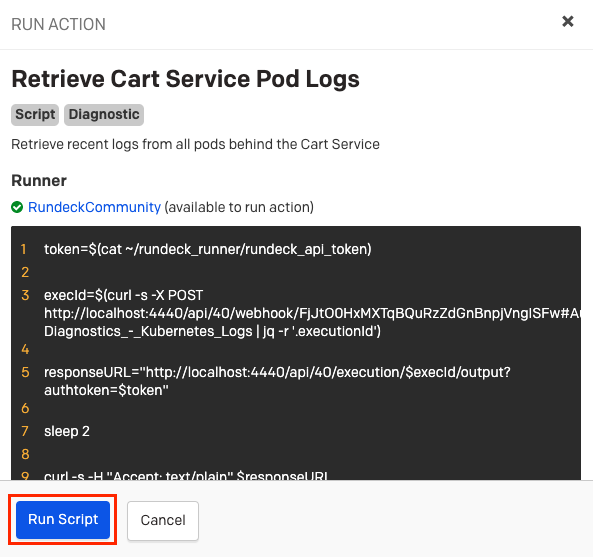
- Click on the Run Actions dropdown, and then click the automation-action configured in the prior section:
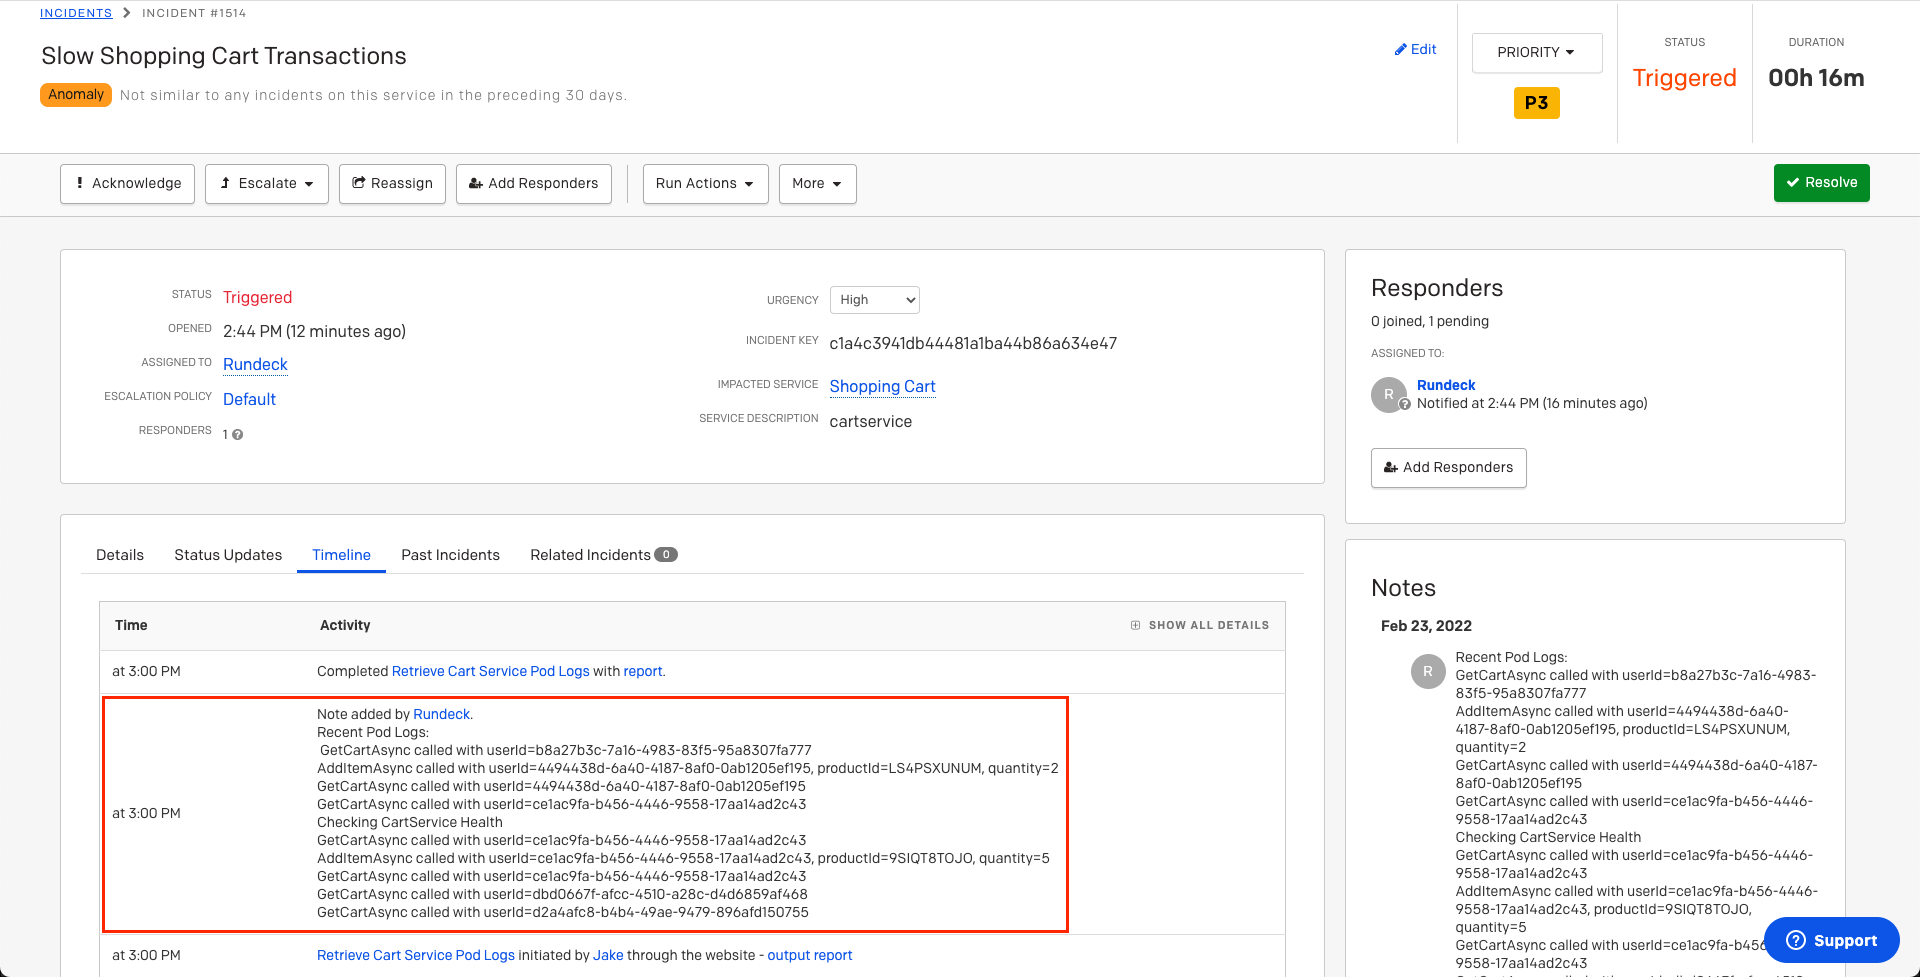
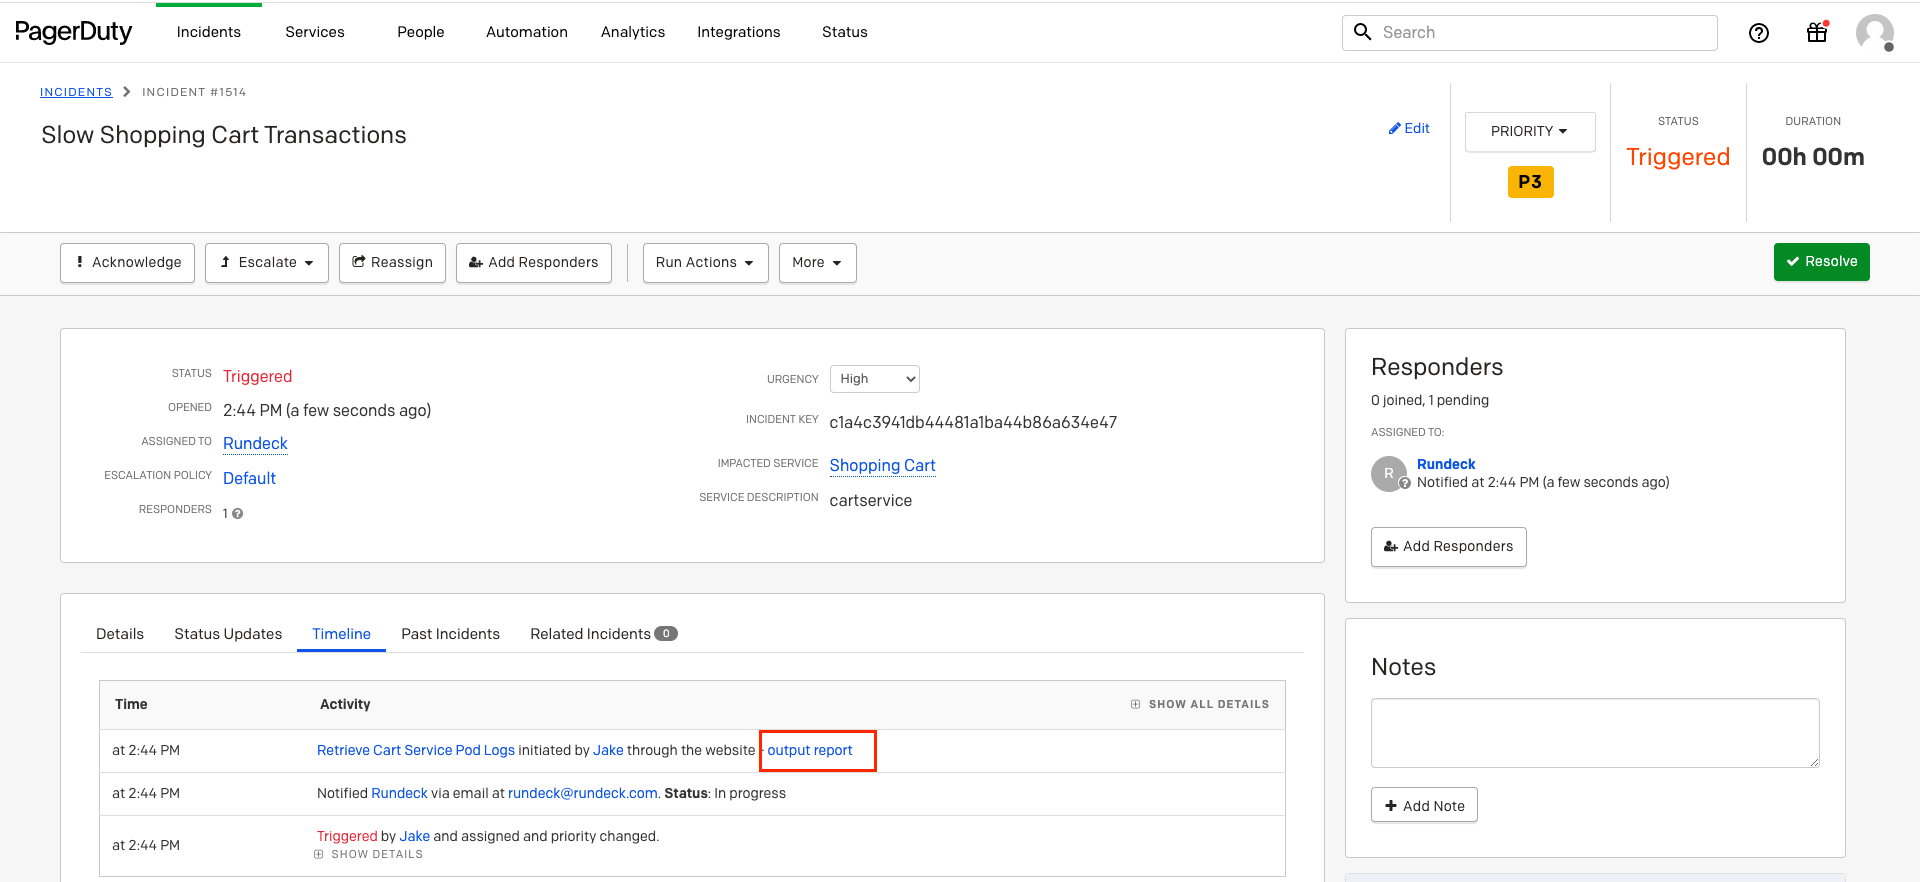
This will post the diagnostic-data to the PagerDuty incident timeline: