# Automated Diagnostics
# Example: Linux Host Diagnostics
Let's walk through an example for how to target a specific host with our diagnostics.
- Click on a prior incident for the PagerDuty Service in question. It can be a Resolved or Active incident.
- Expand the Custom Details on the Incident
- Locate the field that serves as the host "identifier". In this example Incident from Datadog,
orig-sourceworks - since it is our EC2 instance ID:
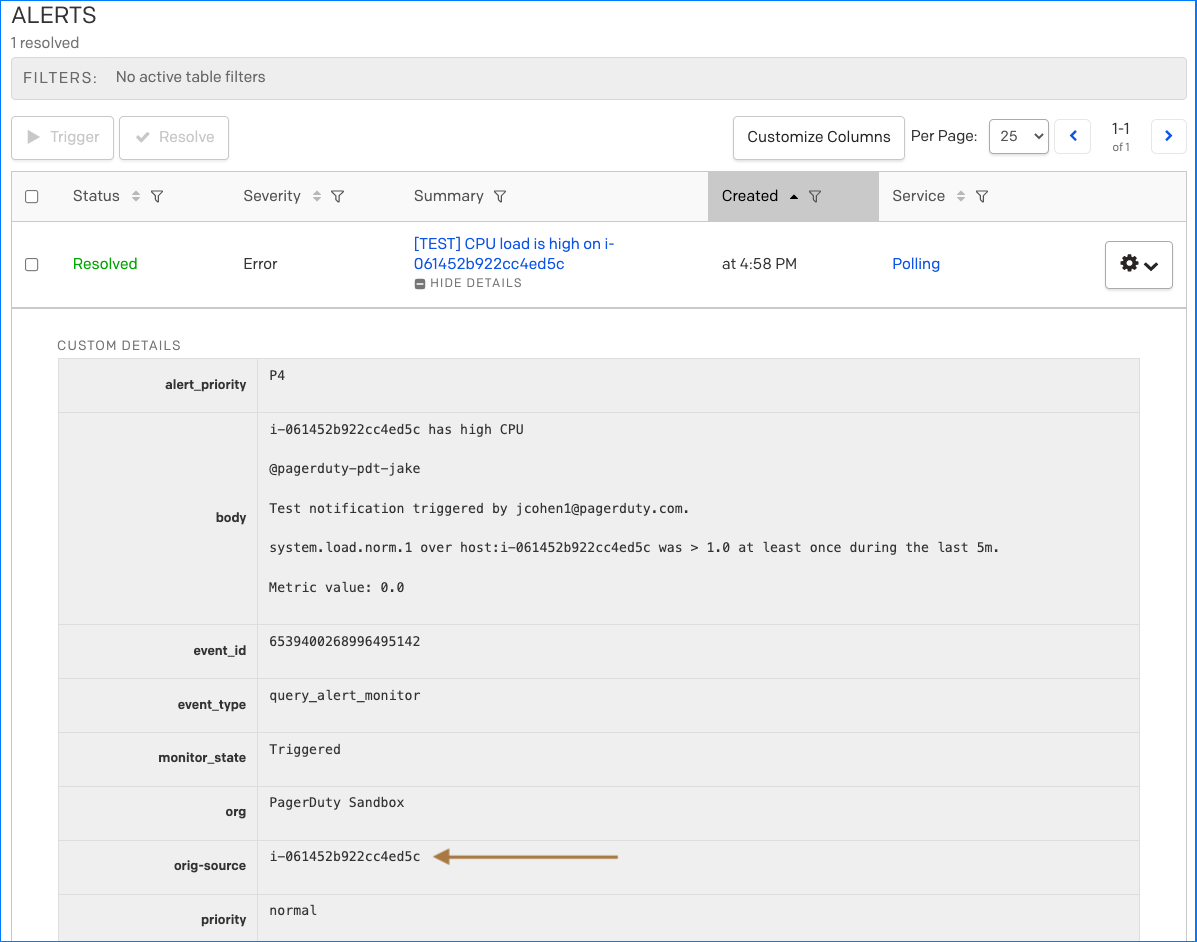
- This is the field that will be passed to Runbook Automation to specify the Node to target.
- Copy the field name for this host identifier.
- Navigate to edit the Automation Action you created in the prior section:
- Automation -> Automation Actions Click on the Action you created and then click on Edit
- Add the following to the Enter Process Automation arguments field:
-node_filter ${pd.alert.details.orig-source}- Replace
orig-sourcewith the field name from Step 4:
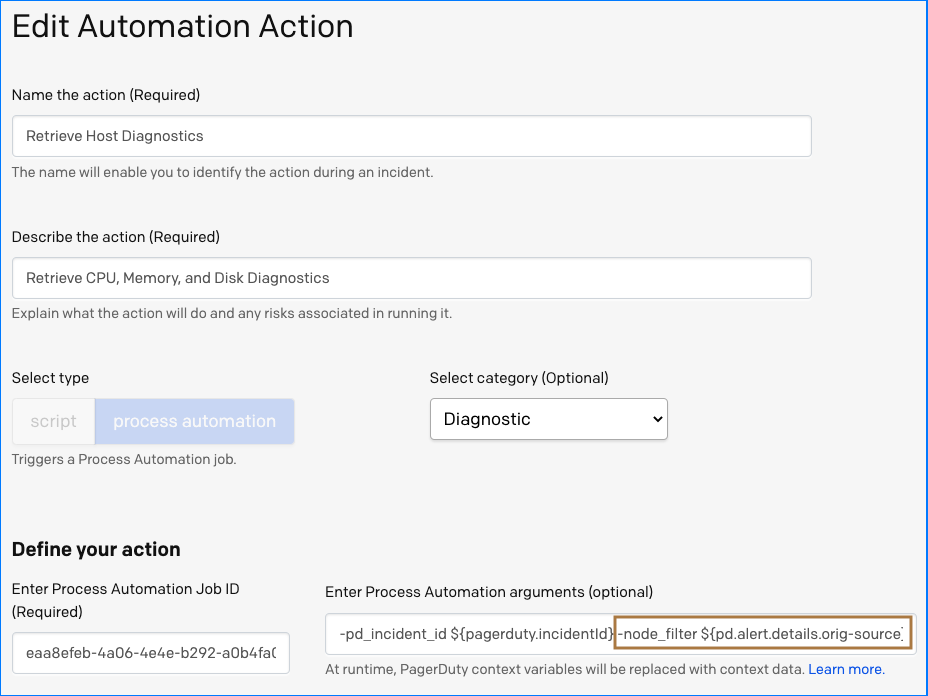
- Click Update Action
- Refresh the Incident page for the Service, and click the Run Actions dropdown:
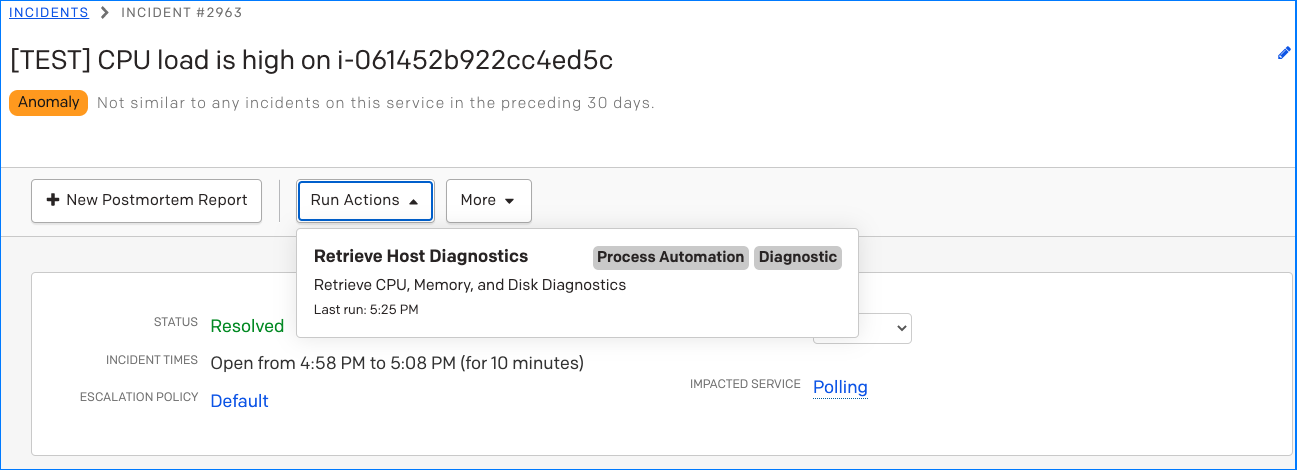
You will now see the host identifier in the arguments of the invocation pane:
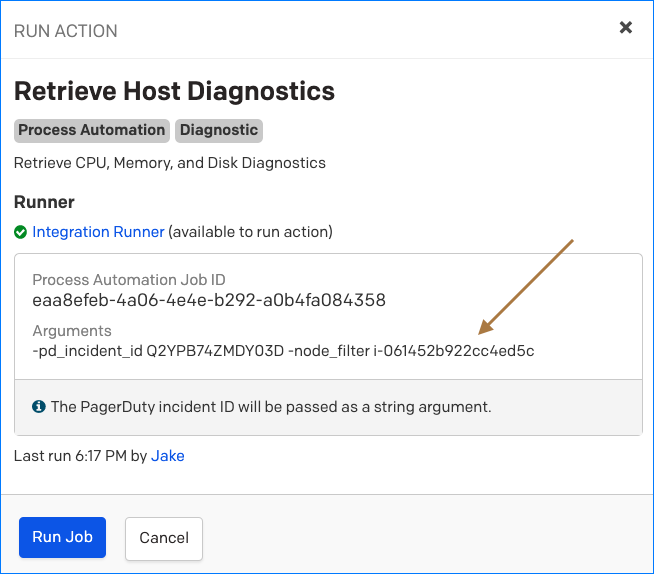
- Click Run Job. You can optionally view the status of the invocation by clicking on the output report on the incident timeline.
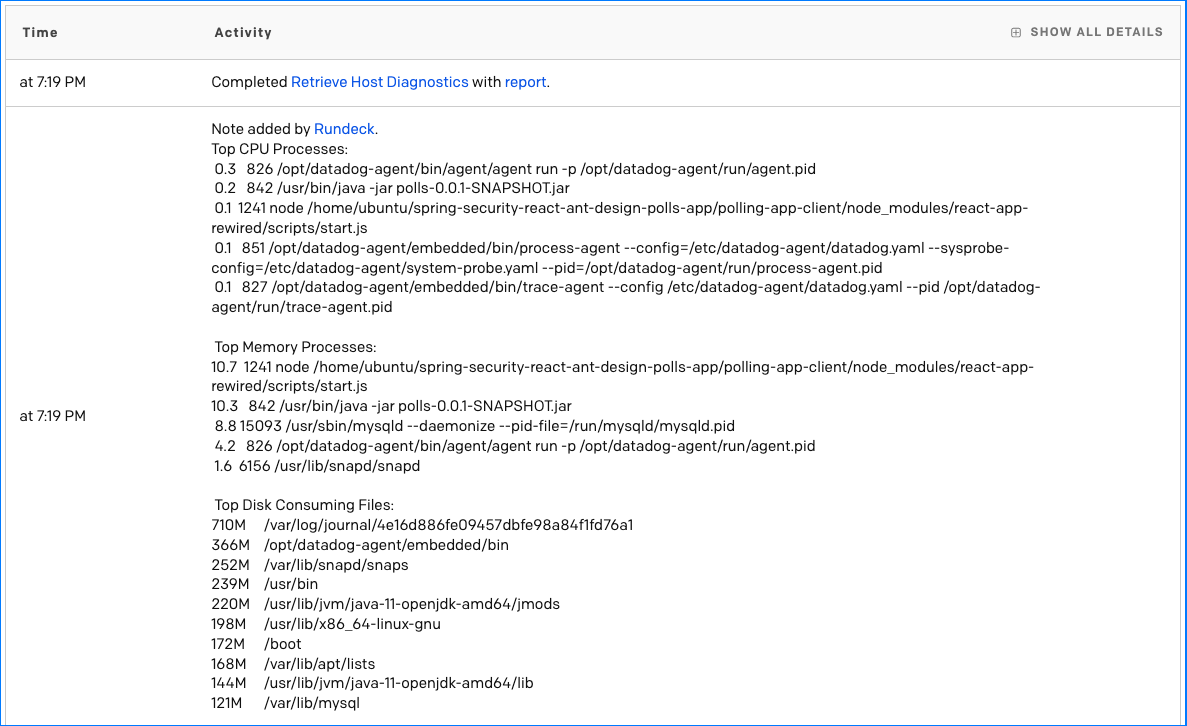
If the configuration was successful, the Automated Diagnostic Job will execute and the diagnostics will be posted to the Incident Timeline:
Heads Up!
If the parameters in the Process Automation Arguments (Step 6) do not match those in the Job Options of the associated Runbook Automation Job, then you will see the following log in the Automation Actions output report:
Rundeck communication error. Status: 400
Be sure that all Job Options are present in the Process Automation Arguments and that they are all spelled exactly the same.
# Instance Attributes for Automation Actions Node Filter
If the Node names in Runbook Automation do not directly match the instance-identifier on the PagerDuty incident, you can modify the Node Filter syntax within the Automation Action to associate it with the correct Nodes.
For example, in Runbook Automation, EC2's might be discovered by their display-name:
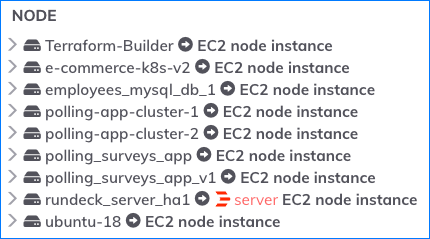
In this case, we would use the instanceId node-attribute:
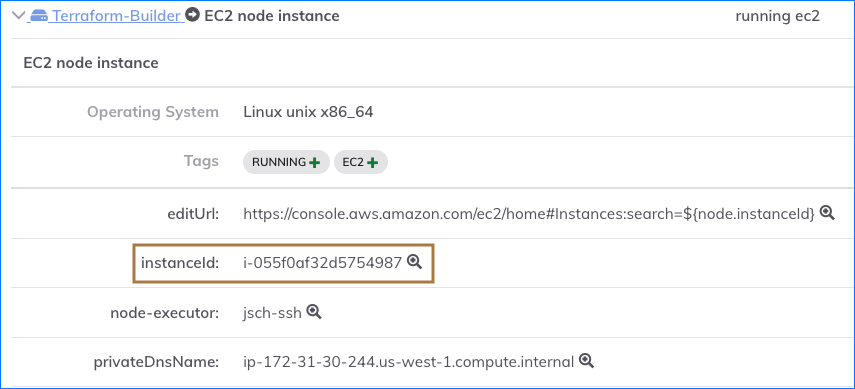
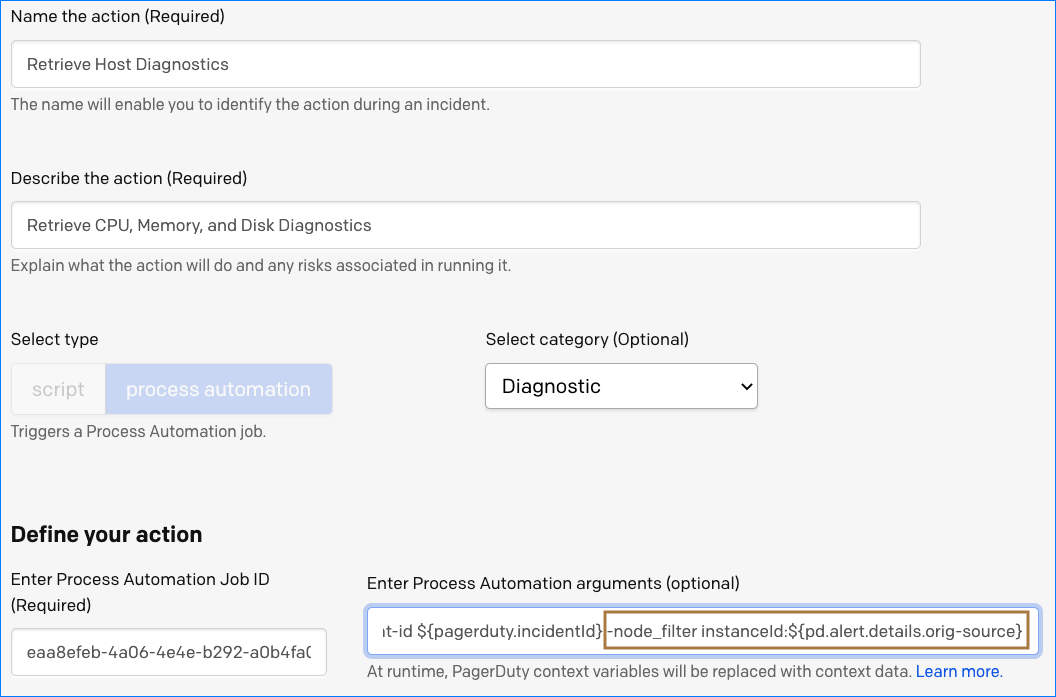
So in Automation Actions, the Process Automation Arguments would be
-node_filter instanceId:${pd.alert.details.orig-source}, as shown here: