Commands
A command is a single executable string executed on a Node. Rundeck invokes commands on nodes via a node executor which evaluates the command string and executes it. Node executors evaluate the command string in a data context containing information about the Node resource. Command strings can reference this data and thus avoid hard coding node or environment specific values.
The Rundeck graphical console provides the ability to execute commands to a set of filtered Node resources. The Command page can accept any command string you might run via an SSH command or via the dispatch shell tool.
Note, your ability to view Nodes and execute commands on them depends on your ACL policy.
Commands tab overview
Navigate to this page by clicking on the "Commands" tab in the navigation bar. Alternatively, go to the Nodes tab and choose the "Node Actions" menu and select the "Run a command ..." menu item.
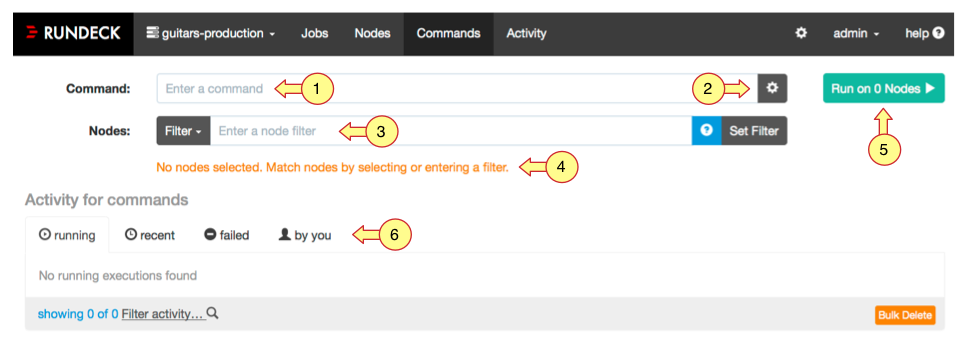
The screenshot above shows the elements of the Commands page user interface.
- Command prompt - Enter the command string.
- Command dispatch settings - Optional settings to control concurrency and errors.
- Filter expression - Search expression to match nodes.
- Filter results list - Matching nodes presented as a list here.
- Run command button - Execute command for command string and matched nodes.
- Activity views - Historical views of command executions.
Enter a command
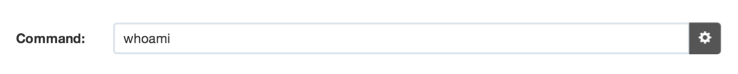
Input command string
Enter the command string you wish to execute on the Nodes. This command string must be a valid command statement that can be executed on the nodes.
Dispatch settings
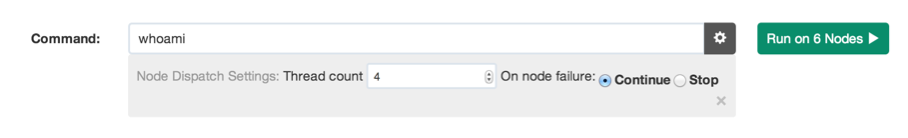
Choose dispatch settings
The dispatch settings let you control the amount of concurrency and error handling for the command execution.
- Thread count: Number of concurrent command executions. By default the value is 1 which causes a sequential execution.
- On node failure: If a command execution fails on the node, you can choose to continue (default) or stop immediately at the failed node.
Select the nodes
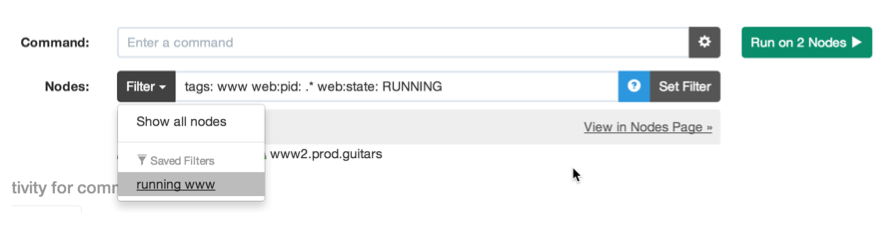
Filter the nodes
You can choose the nodes by either choosing a saved filter or typing in your own filter expression. Press the "Set Filter" button to find the matched nodes. You can get help on filter expression syntax by pressing the help button.
Node detail
Each of the matched nodes is linked to a detail view where you can inspect the Node's attribute values (1).
You can click the filter links inside the detail view to continue building your filter expression (2).
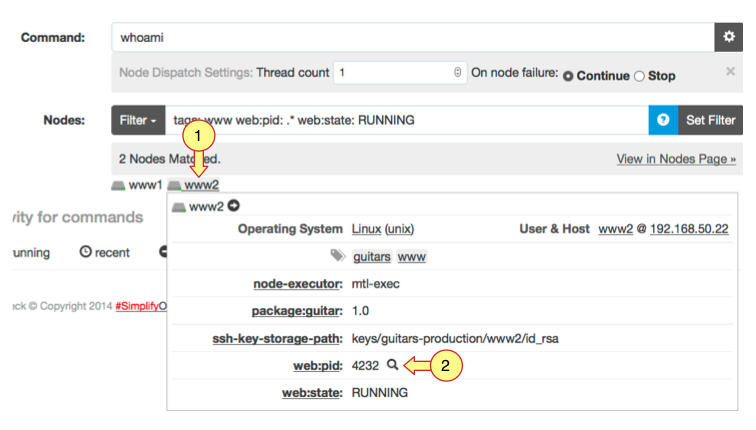
Node detail
Execute command
With the command string and filter entered you are ready to run the command. Press the "Run on x Nodes" button to begin the execution.
The command will be dispatched to all the Nodes matched by the filter. The command prompt and run button become disabled until the execution completes. Output from the command execution is shown below.
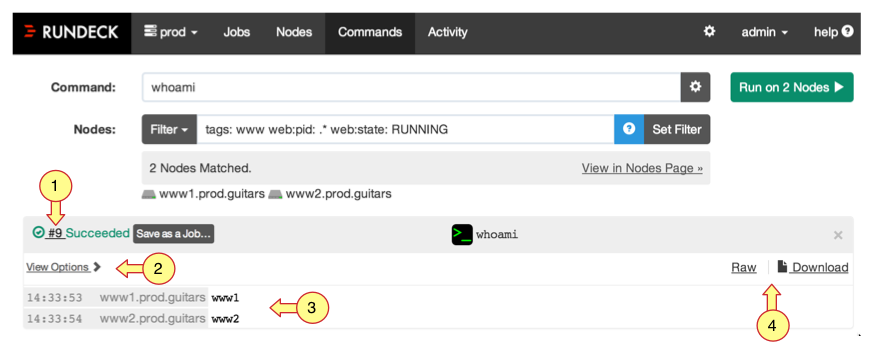
Command execution output
- Link to execution page: Every execution has an ID an a separate page to follow it and view a report after it completes.
- View options: Output is automatically collated by node and contains time information. You can toggle these as desired.
- Collated output: All output is grouped by the node.
- Output log links: You can view the raw output in the browser or download it to your desktop.
You can dismiss the output by pressing the "X" button above the Download link.
Monitor the execution
Once the command execution begins you can monitor its progress on the Commands page or a separate execution follow page discussed later.
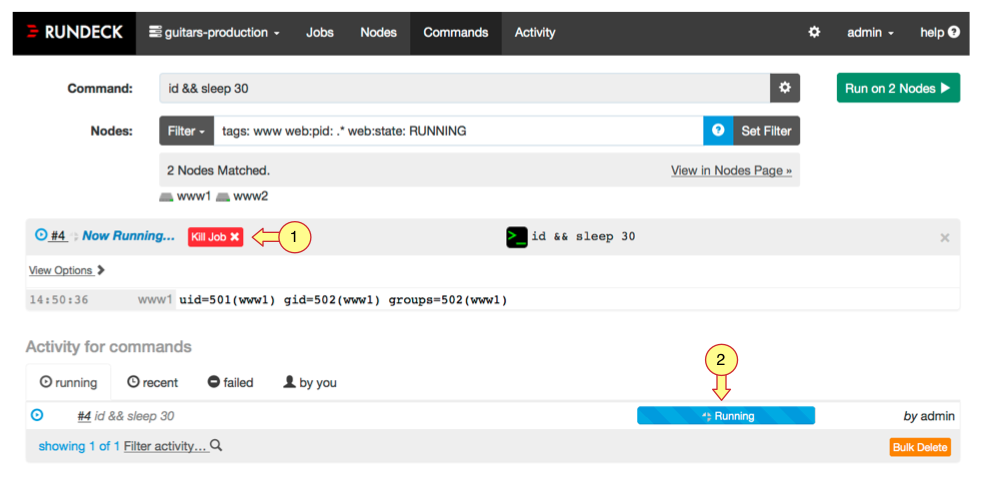
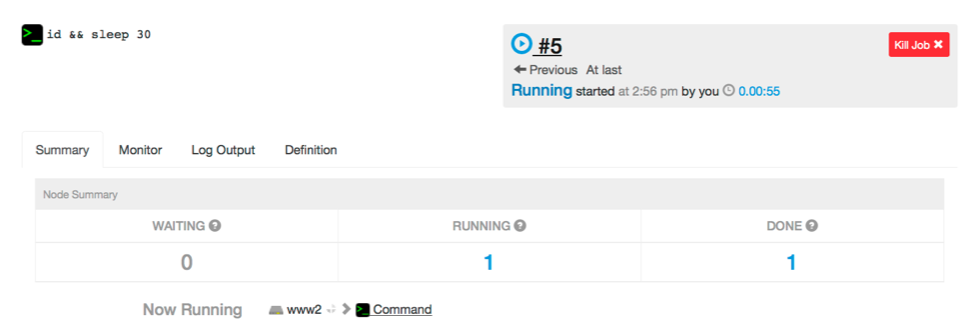
Now running a command
- Kill job button: You can kill the execution by pressing this button.
- Execution status bar: If you dismissed the output view, you can continue monitoring progress in the "running" tab in the Activity section.
Output view options
This page section provides several views to read the output using different formats.

View options
- Log view
Displays output messages from the command execution as if you were running the Unix
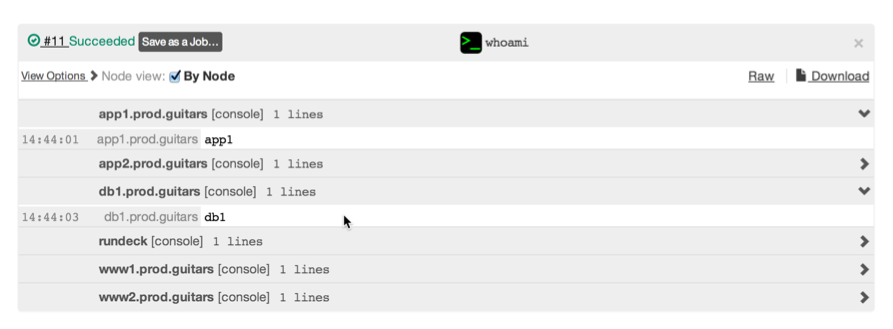
tail -fcommand on the output log file.- By Node
Output messages are sorted into Node specific sections and are not interlaced. By default, the messages are collapsed but can be revealed by pressing the disclosure icon to the right.
Execution follow page
Sometimes it is useful to have a page where just the execution output is displayed separately. One purpose is to share a link to others interested in following the output messages. Click the progress bar in the "Activity" section to go to the execution follow page.
Execution follow view
Notice the URL in the location bar of your browser. This URL can be shared to others interested in the progress of execution. The URL contains the execution ID (EID) and has a form like:
http://rundeckserver/project/prod/execution/show/{EID}After execution completes, the command will have a status:
- Successful: No errors occurred during execution of the command across the filtered Node set
- Failed: One or more errors occurred. A list of Nodes that incurred an error is displayed. The page will also contain a link "Retry Failed Nodes..." in case you would like to retry the command.
Execution history
The Commands page provides several views about execution history.
- running: Shows any currently running command executions.
- recent: Shows any executions from the last 24 hours.
- failed: Shows failed executions from last 24 hours.
- by you: Shows executions started by you.
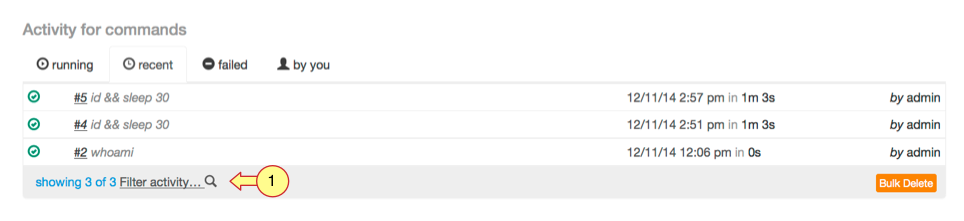
Recent history
You can further search activity history by clicking the "Filter activity..." link.